Note
Go to the end to download the full example code.
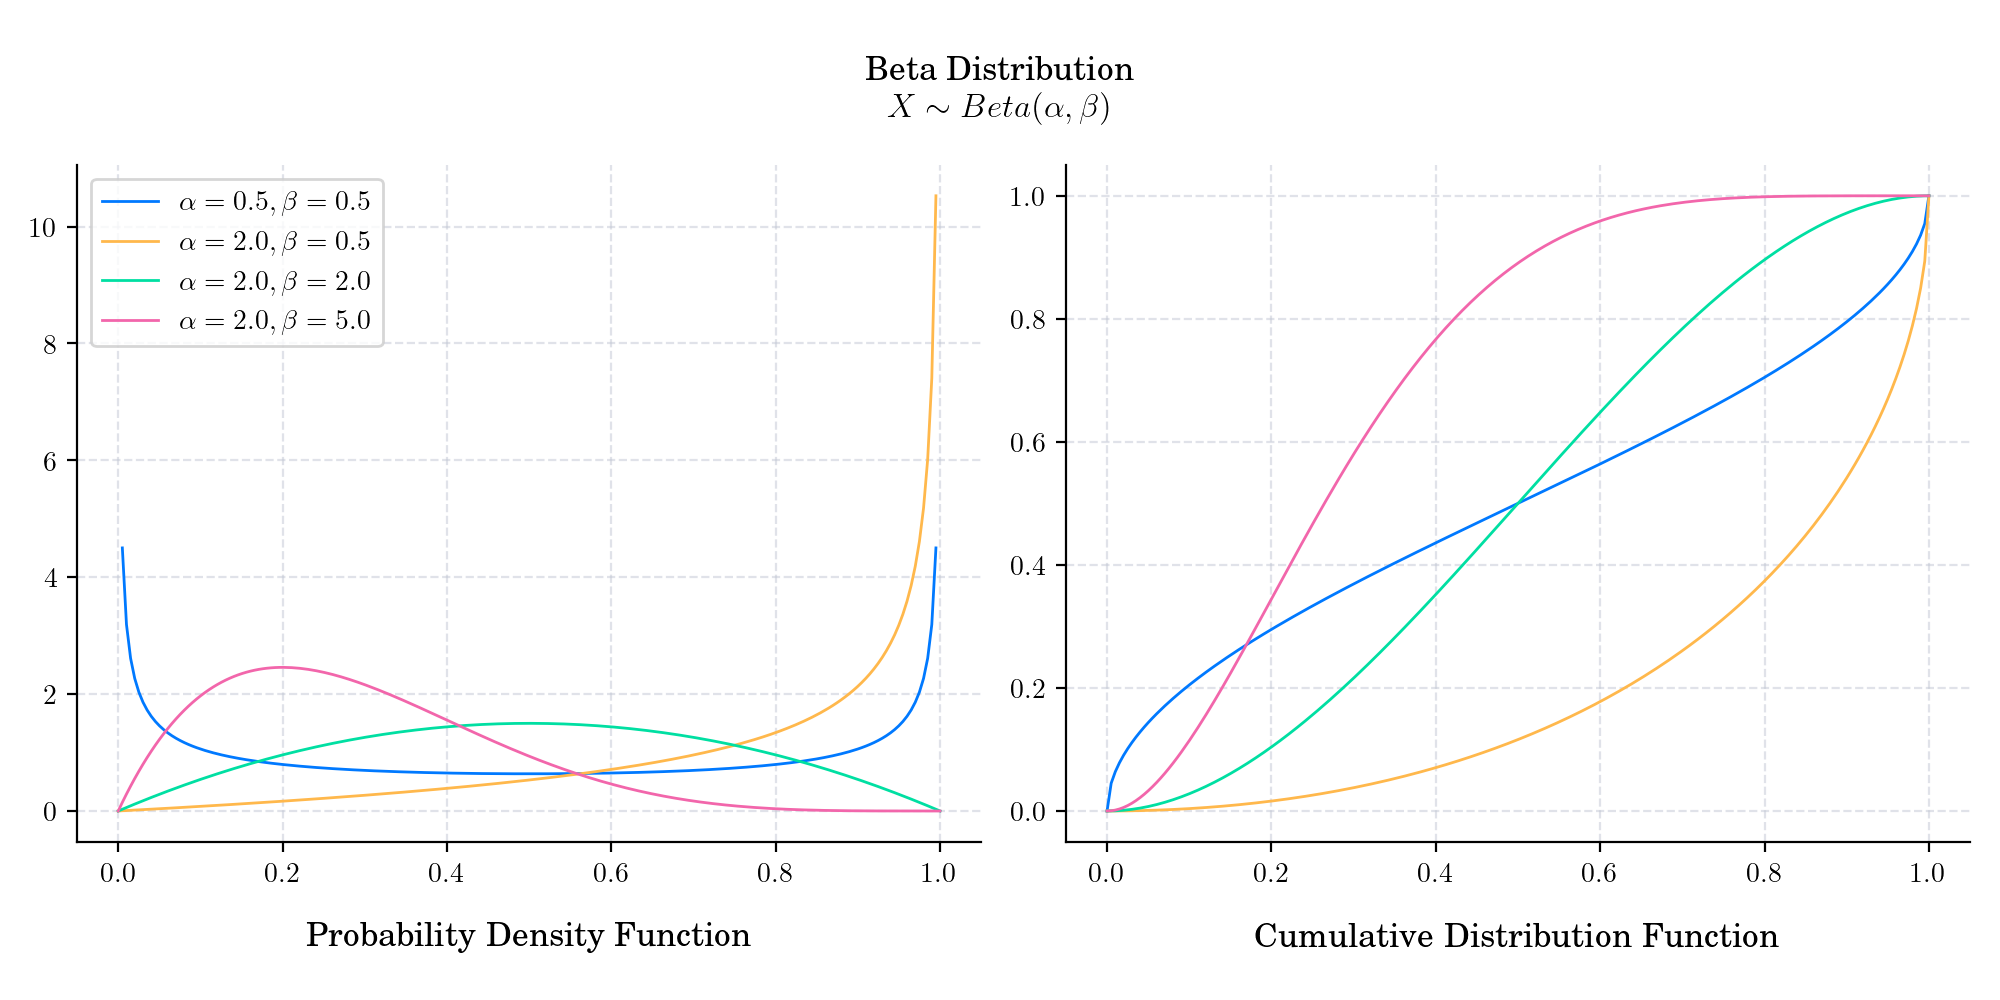
Day 2 : Beta#
# Author: Dialid Santiago <d.santiago@outlook.com>
# License: MIT
# Description: Advent Calendar 2023

import matplotlib.pyplot as plt
from matplotlib.gridspec import GridSpec

from scipy.stats import beta
import numpy as np

plt.style.use("https://raw.githubusercontent.com/quantgirluk/matplotlib-stylesheets/main/quant-pastel-light.mplstyle")


def plot_beta(parameters, title=None, line_labels=True, **kwargs):
    title = title if title else f"\n Beta Distribution \n $X \\sim Beta(\\alpha, \\beta)$"

    fig = plt.figure(figsize=(10, 5), *kwargs)
    gs = GridSpec(1, 4, wspace=0.5)
    ax1 = fig.add_subplot(gs[:2])
    ax2 = fig.add_subplot(gs[2:])
    x = np.linspace(0, 1, 200)
    for (a, b) in parameters:
        rv = beta(a, b)

        if line_labels:
            ax1.plot(x, rv.pdf(x), label=f"$\\alpha={a},  \\beta={b}$")
            ax2.plot(x, rv.cdf(x), label=f"$\\alpha={a},  \\beta={b}$")
            ax1.legend()
        else:
            ax1.plot(x, rv.pdf(x))
            ax2.plot(x, rv.cdf(x))

    ax1.set_title('Probability Density Function', y=-0.18)

    ax2.set_title('Cumulative Distribution Function', y=-0.18)

    fig.suptitle(title)
    gs.tight_layout(fig)

    plt.show()

    return fig


def main():
    params = [(0.5, 0.5), (2.0, 0.5), (2.0, 2.0), (2.0, 5.0)]
    figure = plot_beta(params, dpi=200)
    # figure.savefig('02_Beta')


if __name__ == "__main__":
    main()
Total running time of the script: (0 minutes 1.831 seconds)