Day 17 : Generalised Extreme Value#
The generalized extreme value (GEV) distribution is a family of continuous probability distributions developed within extreme value theory to combine the Gumbel, Fréchet and Weibull families which are also known as type I, II and III Extreme Value Distributions (EVD). It is defined by three parameters: a location parameter \(\mu\in\mathbb{R}\), a scale parameter \(\sigma>0\), and a shape parameter \(\xi\in\mathbb{R}\). The shape parameter defines which distribution the generalised extreme value distribution takes on:
When \(\xi\) is equal to 0, the GEV is equal to EVD Type I (Gumbel).
When \(\xi\) is greater than 0, the GEV is equal to EVD Type II (Fréchet).
When \(\xi\) is less than 0, the GEV is equal to EVD Type III (Weibull).
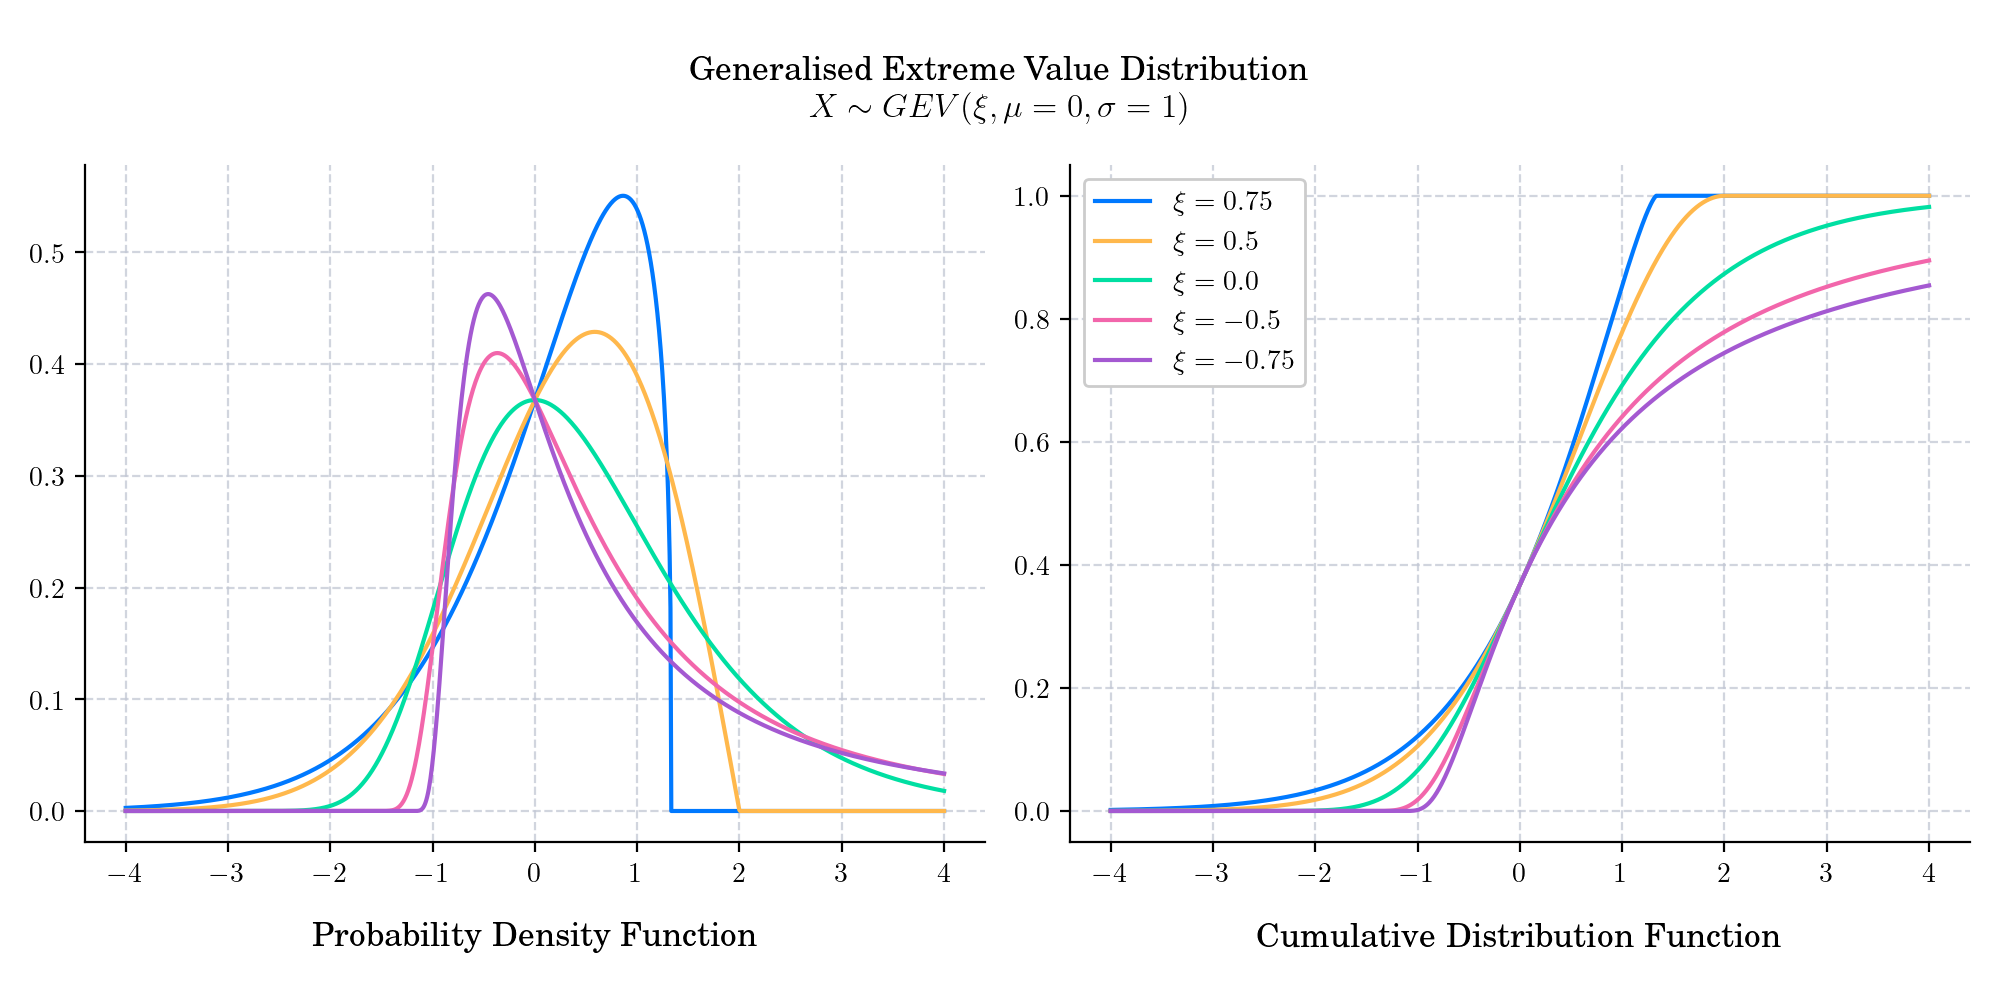
The probability density function is given by
where
The cumulative distribution function is given by
where \(t(x)\) is defined as above.
🔔 Random Facts 🔔#
In some fields of application the generalized extreme value distribution is known as the Fisher–Tippett distribution, after British polymath Ronald Fisher and English statistician L. H. C. Tippett who recognised three different forms of the family.
The GEV distribution is widely used in the treatment of “tail risks” in fields ranging from insurance to finance. In the latter case, it has been considered as a means of assessing various financial risks via metrics such as value at risk (VaR).
In hydrology the GEV distribution is applied to extreme events such as annual maximum one-day rainfalls and river discharges. See e.g. the paper “Quantifying annual occurrence probability of rainfall-induced landslide at a specific slope” published in 2022.
If \(X\sim Exponential(1)\), then for any \(\mu\in\mathbb{R}, \sigma>0\) the random variable \(Y = \mu - \sigma \log X\) follows a GEV distribution with parameters \(\mu, \sigma\) and \(\xi=0\), i.e. \(Y\sim GEV(\mu, \sigma, 0)\).
Today’s bonus is a picture of an art piece by an unknown author showing Lisbon, Portugal, during the great earthquake of 1 November 1755. This copper engraving, made that year, shows the city in ruins and in flames. Tsunamis rush upon the shore, destroying the wharfs. The engraving is also noteworthy in showing highly disturbed water in the harbor, which sank many ships. Passengers in the left foreground show signs of panic. Extreme value theory is used to model the risk of extreme, rare events, such as the 1755 Lisbon earthquake.
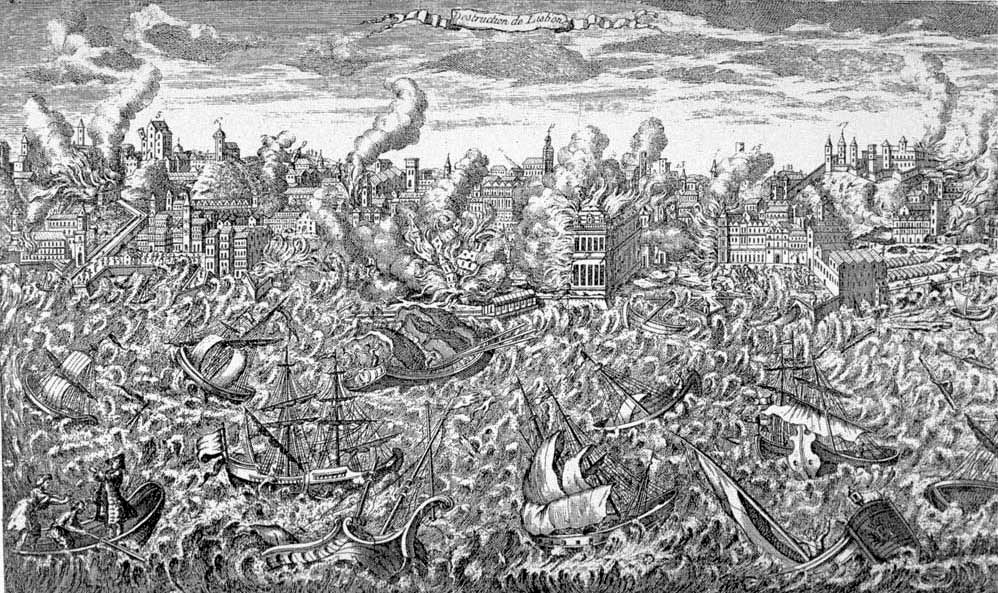
Source: Wikipedia Extreme Value Theory