Note
Go to the end to download the full example code.
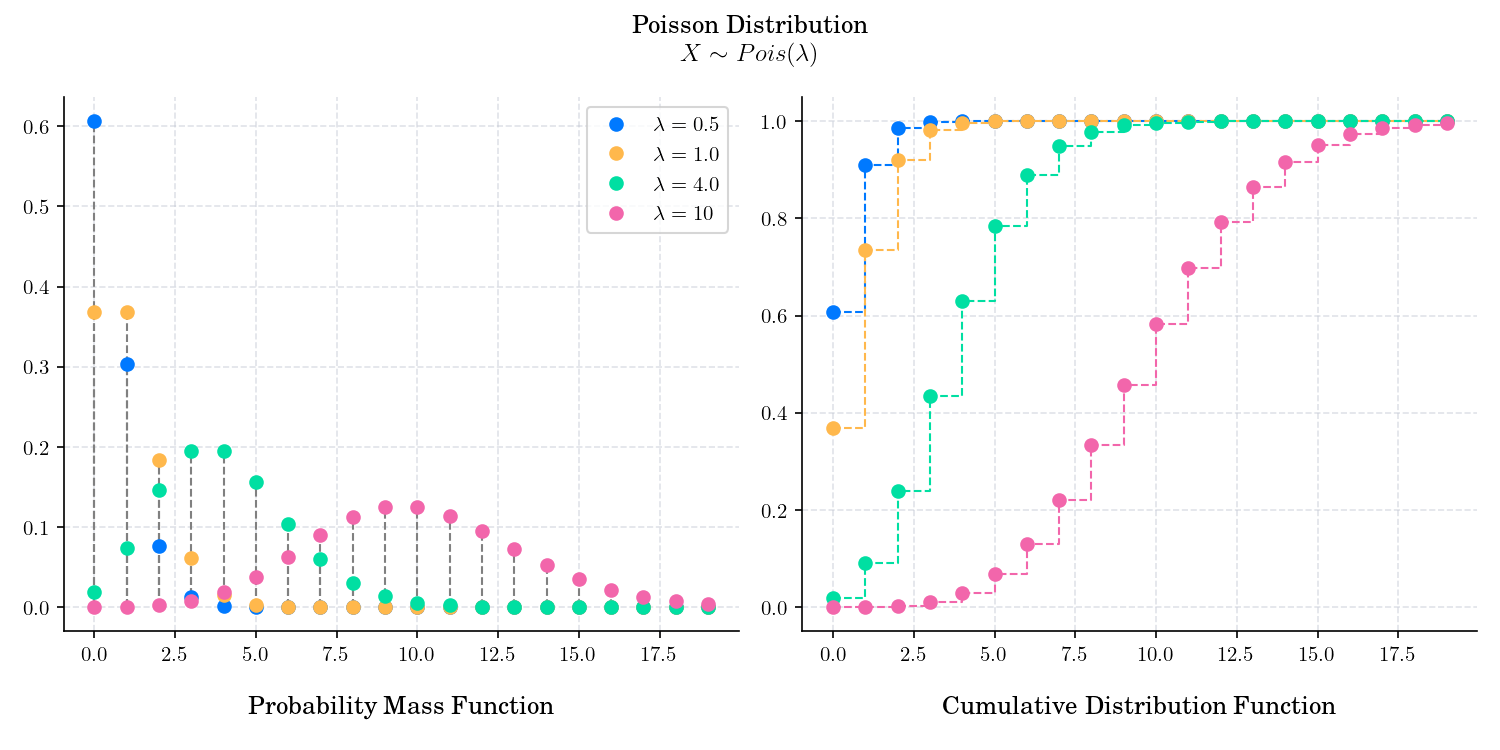
Day 5 : Poisson#
# Author: Dialid Santiago <d.santiago@outlook.com>
# License: MIT
# Description: Advent Calendar 2023

import matplotlib.pyplot as plt
from matplotlib.gridspec import GridSpec

from scipy.stats import poisson
import numpy as np

plt.style.use(
    "https://raw.githubusercontent.com/quantgirluk/matplotlib-stylesheets/main/quant-pastel-light.mplstyle")

x = np.arange(0, 20, 1)
title = f"Poisson Distribution \n $X \\sim Pois(\\lambda)$"

fig = plt.figure(figsize=(10, 5), dpi=150)
gs = GridSpec(1, 4, wspace=0.5)
ax1 = fig.add_subplot(gs[:2])
ax2 = fig.add_subplot(gs[2:])
params = [0.5, 1.0, 4.0, 10]

for l in params:
    rv = poisson(mu=l)
    ax1.vlines(x, 0, rv.pmf(x), colors='grey', linestyles='--', lw=1)

for l in params:
    rv = poisson(mu=l)
    ax1.plot(x, rv.pmf(x), marker='o', linestyle='', label=f"$\\lambda={l}$")
    c = ax1.get_lines()[-1].get_color()
    ax2.plot(x, rv.cdf(x), drawstyle='steps-post',
             color=c,
             lw=1, linestyle='--')
    ax2.plot(x, rv.cdf(x), marker='o', linestyle='')

ax1.legend()
ax1.set_title('Probability Mass Function', y=-0.18)
ax2.set_title('Cumulative Distribution Function', y=-0.18)

fig.suptitle(title)
gs.tight_layout(fig)

# fig.savefig('05_Poisson')
plt.show()
Total running time of the script: (0 minutes 1.074 seconds)