Note
Go to the end to download the full example code.
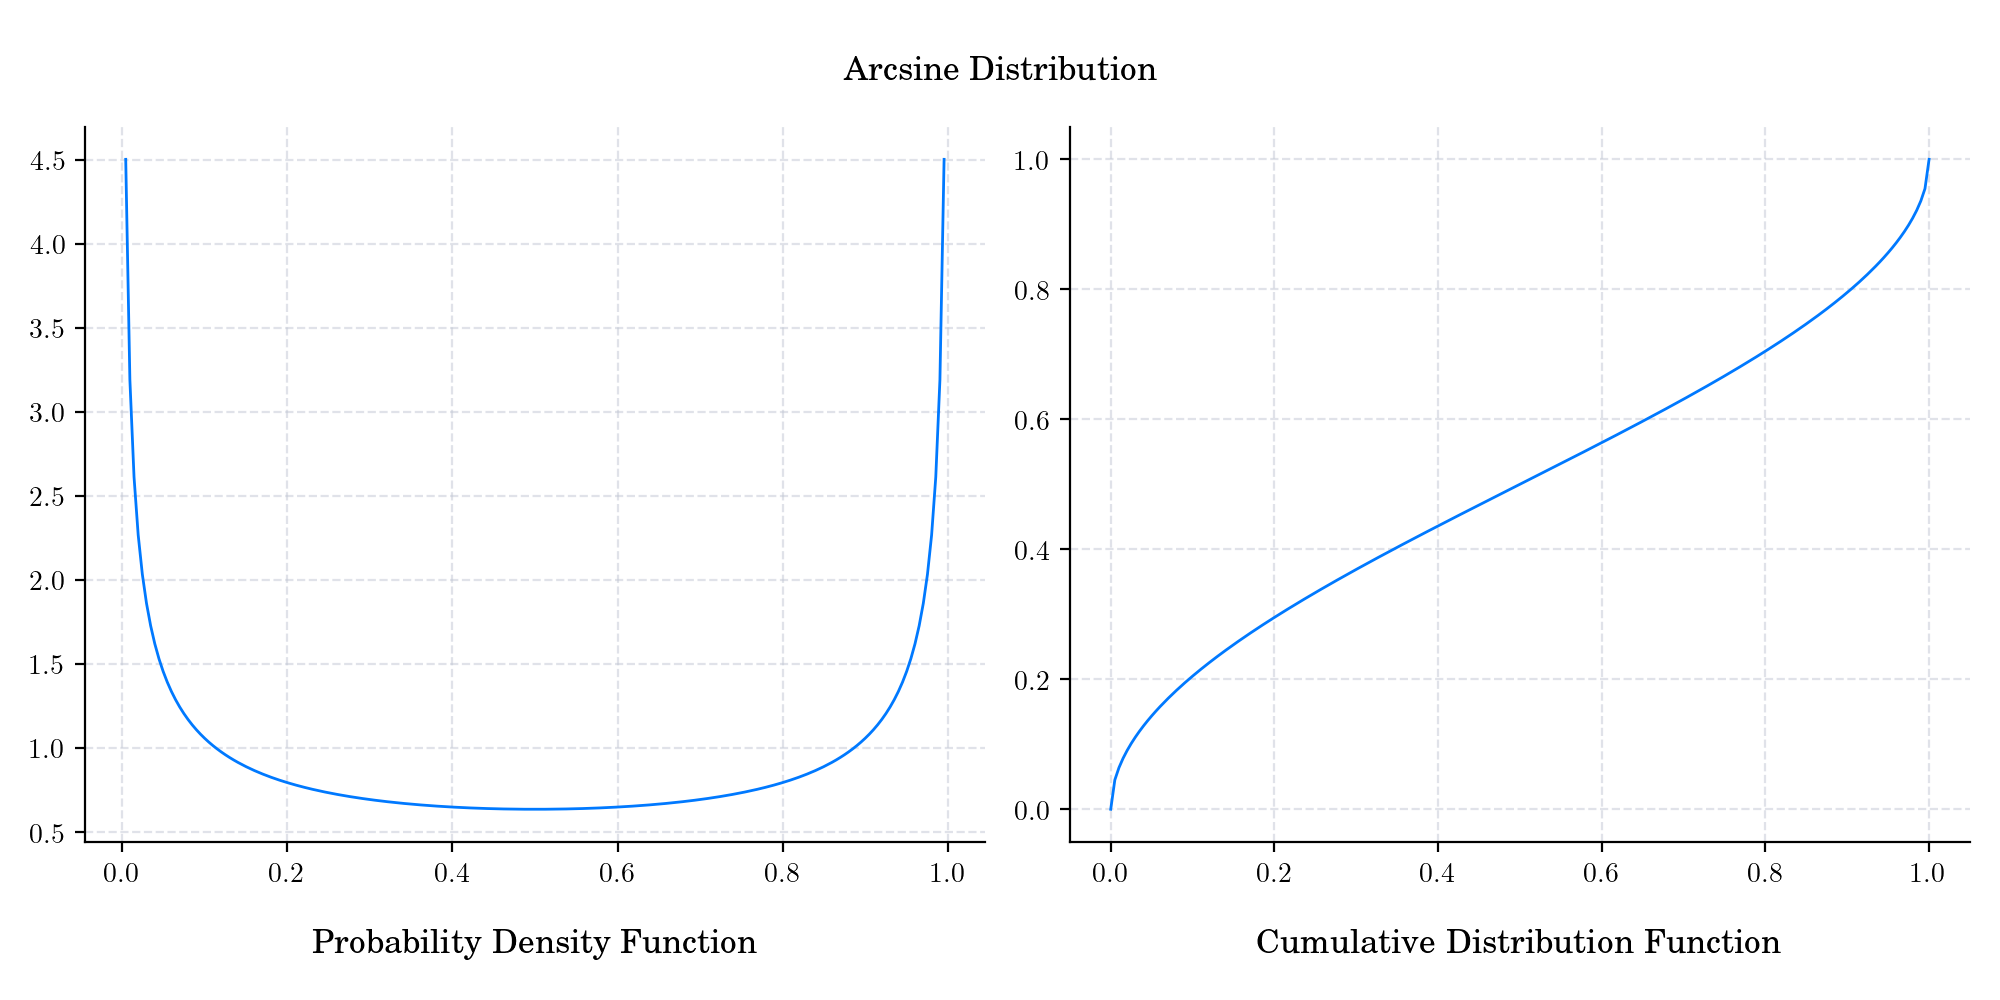
Day 5 : Arc-Sine#
# Author: Dialid Santiago <d.santiago@outlook.com>
# License: MIT
# Description: Advent Calendar 2023

from plot_advent_02_Beta import plot_beta
import matplotlib.pyplot as plt

figure = plot_beta([(0.5, 0.5)], dpi=200, title=f"\n Arcsine Distribution", line_labels=False)
# figure.savefig('06_Arcsine')
plt.show()
Total running time of the script: (0 minutes 1.141 seconds)