Note
Go to the end to download the full example code.
Black Monday#

# Author: Dialid Santiago <d.santiago@outlook.com>
# License: MIT
# Description: Advent Calendar 2025 Day 5 - Black Monday Crash
import yfinance as yf
import pandas as pd
import numpy as np
import matplotlib.pyplot as plt
from scipy.stats import norm
plt.style.use("https://raw.githubusercontent.com/quantgirluk/matplotlib-stylesheets/main/quant-pastel-light.mplstyle")
ticker = "^GSPC"
data = yf.download(ticker, start="1985-01-01", progress=False, auto_adjust=False)
black_monday_date = pd.Timestamp('1987-10-19')
# Close prices
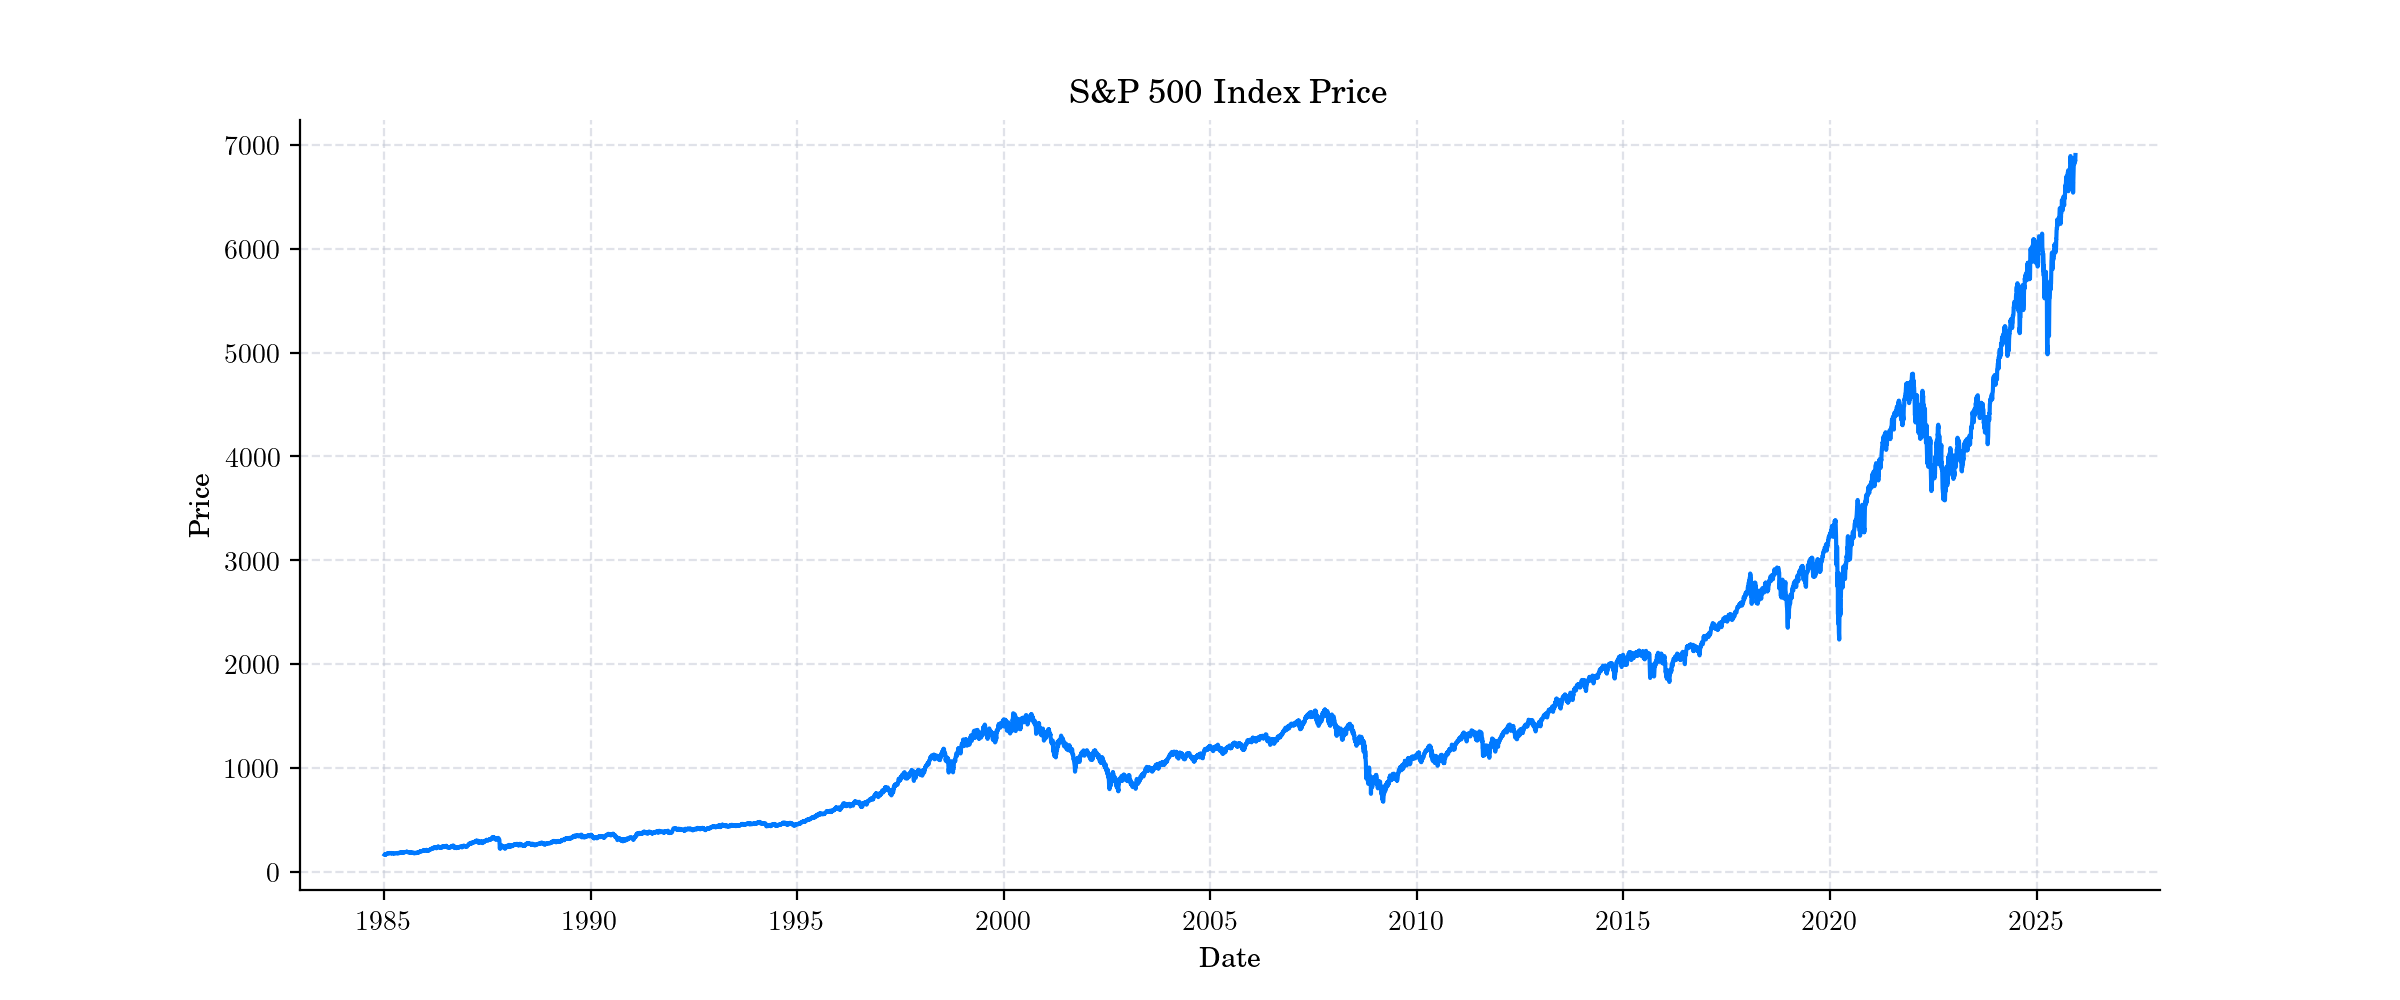
prices = data["Close"]
# Simple returns
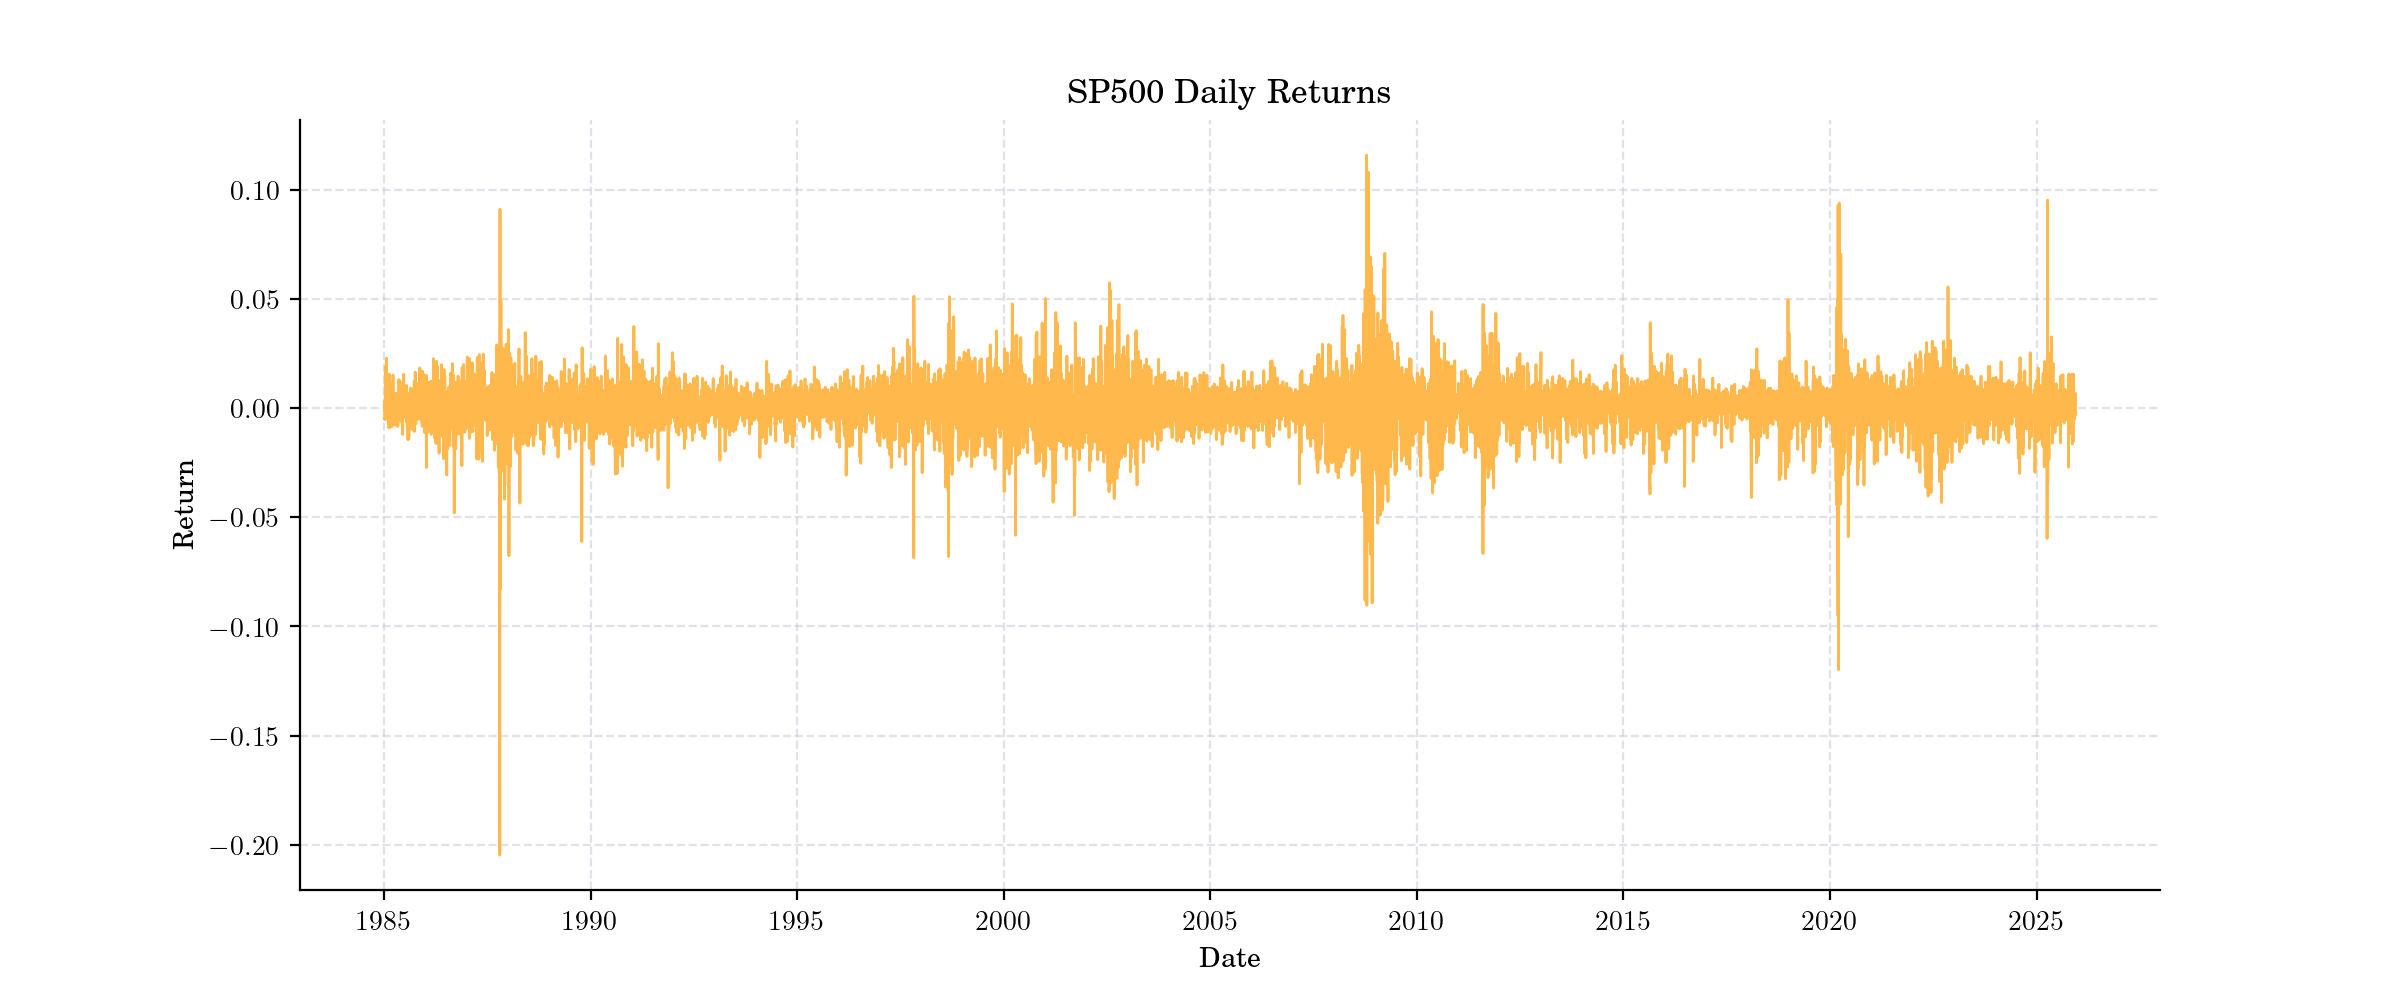
returns = prices.pct_change()
# Logarithmic returns
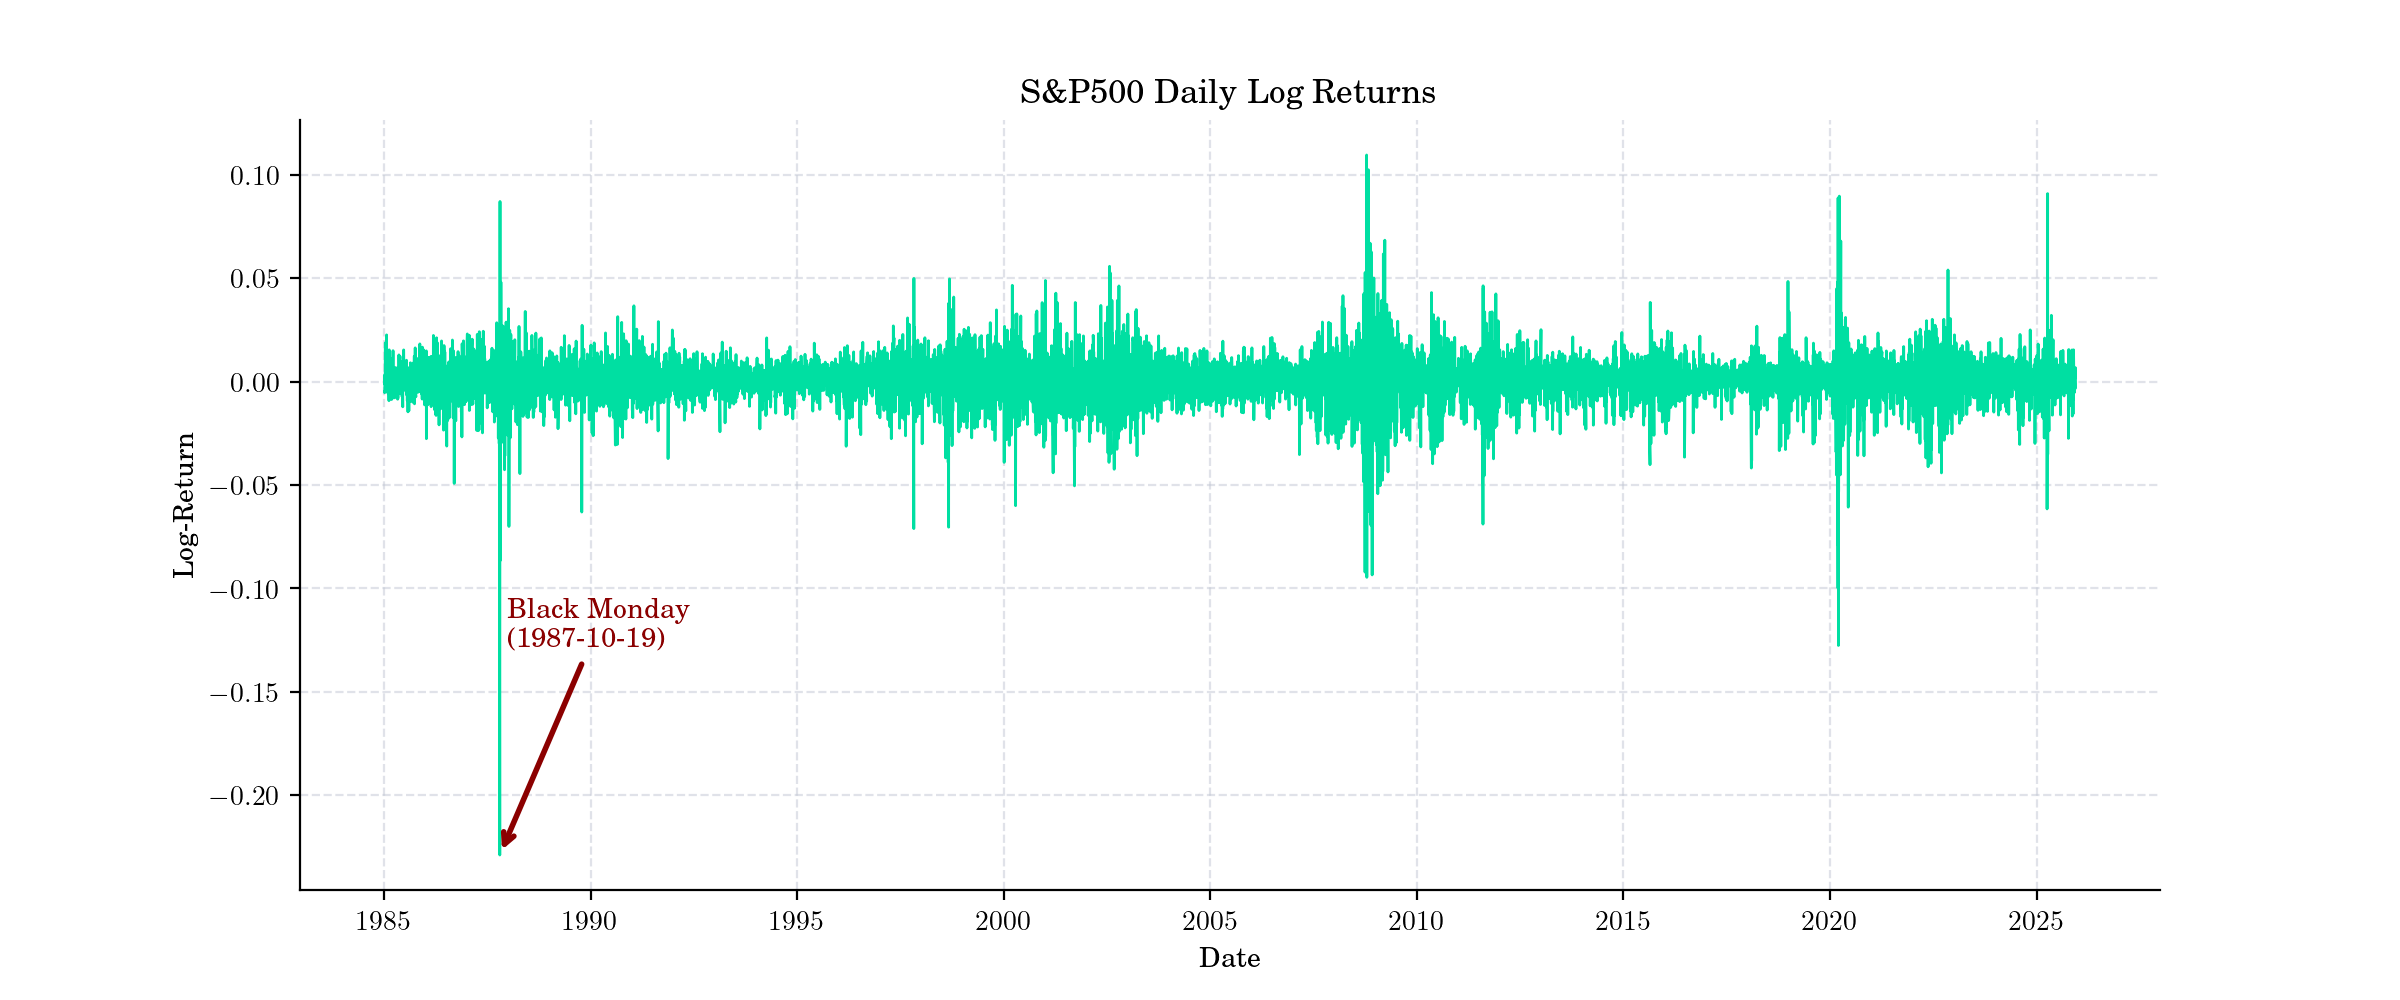
log_returns = np.log(prices / prices.shift(1))
mean = log_returns.mean()
std = log_returns.std()
x = log_returns[log_returns.index == black_monday_date][ticker]
black_monday_log_return = x.values[0]
plt.figure(figsize=(12, 5), dpi=200)
plt.plot(prices, color='#0079ff', linewidth=1.5)
plt.title("S\\&P 500 Index Price")
plt.xlabel("Date")
plt.ylabel("Price")
plt.grid(True)
plt.show()
plt.figure(figsize=(12, 5), dpi=200)
plt.plot(returns, color='#ffb84c')
plt.title("SP500 Daily Returns")
plt.xlabel("Date")
plt.ylabel("Return")
plt.grid(True)
plt.show()
plt.figure(figsize=(12, 5), dpi=200)
plt.plot(log_returns, color='#00dfa2')
if not np.isnan(black_monday_log_return):
plt.annotate(
'Black Monday\n(1987-10-19)',
xy=(black_monday_date ,black_monday_log_return),
xytext=(pd.Timestamp('1987-12-19'), black_monday_log_return + 0.1),
arrowprops=dict(arrowstyle='->', color='darkred', lw=2),
fontsize=10,
ha='left',
color='darkred',
weight='bold'
)
plt.title("S\\&P500 Daily Log Returns")
plt.xlabel("Date")
plt.ylabel("Log-Return")
plt.grid(True)
plt.show()
plt.figure(figsize=(12, 6), dpi=200)
plt.hist(log_returns.dropna(), bins=100, color='#d4Adfc', alpha=0.7)
xmin, xmax = plt.xlim()
x = np.linspace(xmin, xmax, 400)
p = norm.pdf(x, mean, std)
plt.plot(x, p * len(log_returns.dropna()) * (xmax - xmin) / 100, 'darkred', linewidth=1.5, label='Normal Distribution Fit')
if not np.isnan(black_monday_log_return):
plt.annotate(
'Black Monday\n(1987-10-29)',
xy=(black_monday_log_return, 0),
xytext=(black_monday_log_return + 0.05, 250),
arrowprops=dict(arrowstyle='->', color='darkred', lw=2),
fontsize=10,
ha='left',
color='darkred',
weight='bold'
)
plt.title("Histogram of S\\&P 500 Daily Log-Returns")
plt.xlabel("Return")
plt.ylabel("Frequency")
plt.legend()
plt.show()
Total running time of the script: (0 minutes 8.555 seconds)