Note
Go to the end to download the full example code.
Exponential Decay#
# Author: Dialid Santiago <d.santiago@outlook.com>
# License: MIT
# Description: Advent Calendar 2025 - Plot Exponential Decay
import numpy as np
import matplotlib.pyplot as plt
plt.style.use(
"https://raw.githubusercontent.com/quantgirluk/matplotlib-stylesheets/main/quant-pastel-light.mplstyle")
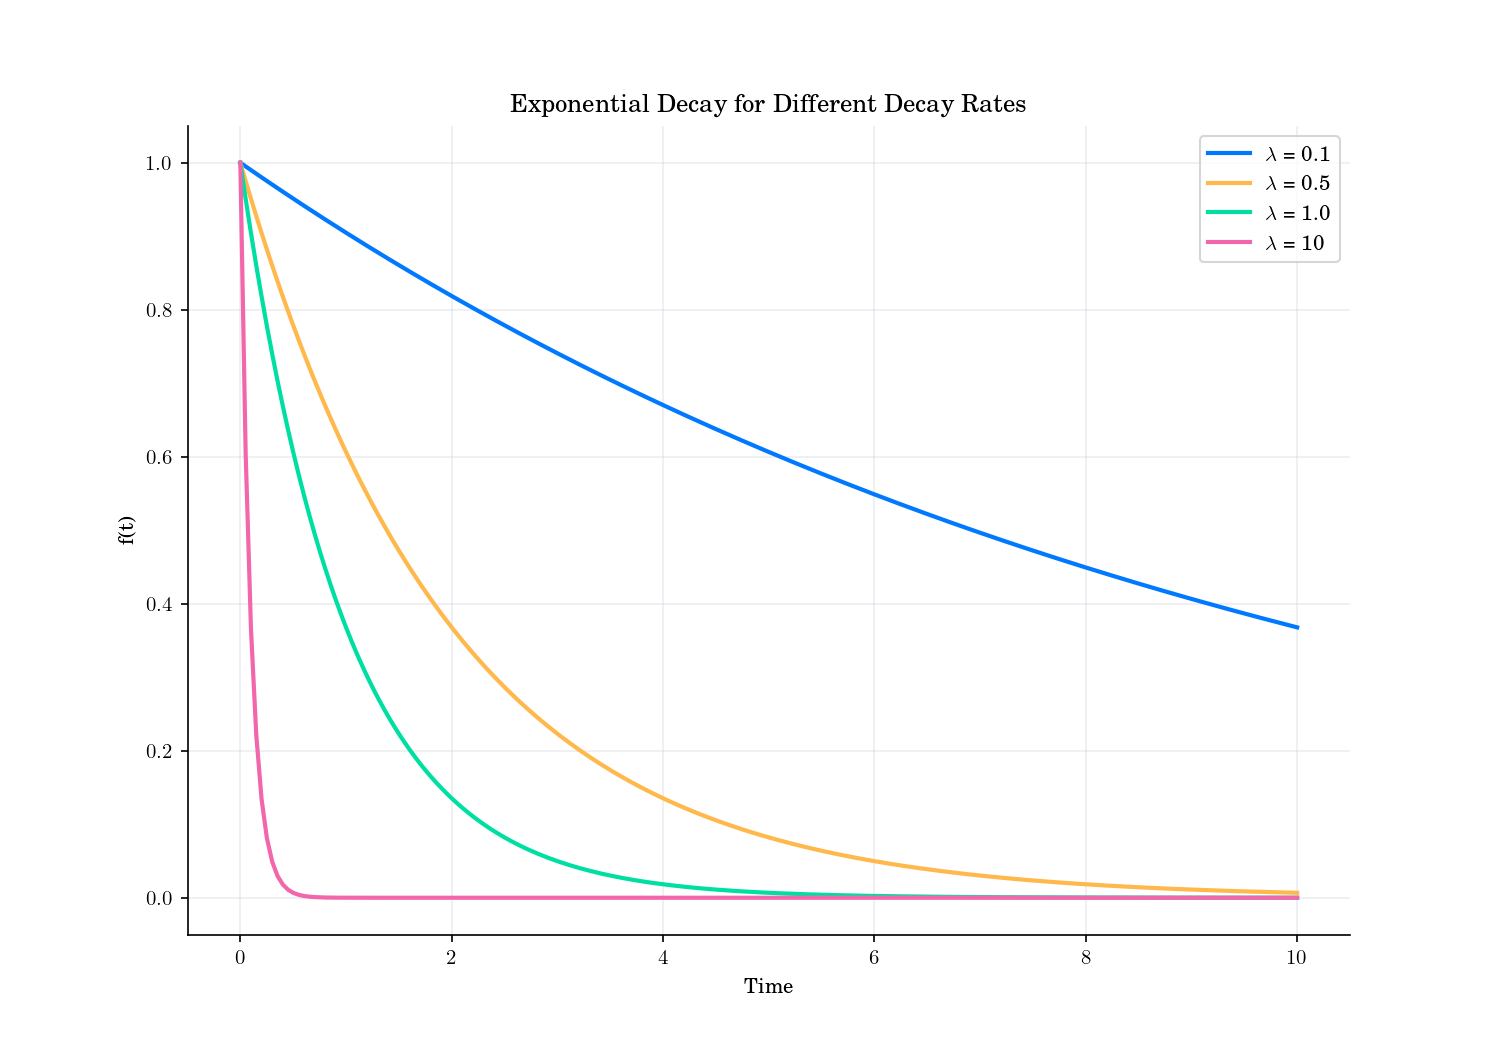
t = np.linspace(0, 10, 200) # time in seconds
lambda_values = [0.1, 0.5,1.0, 10] # decay rates
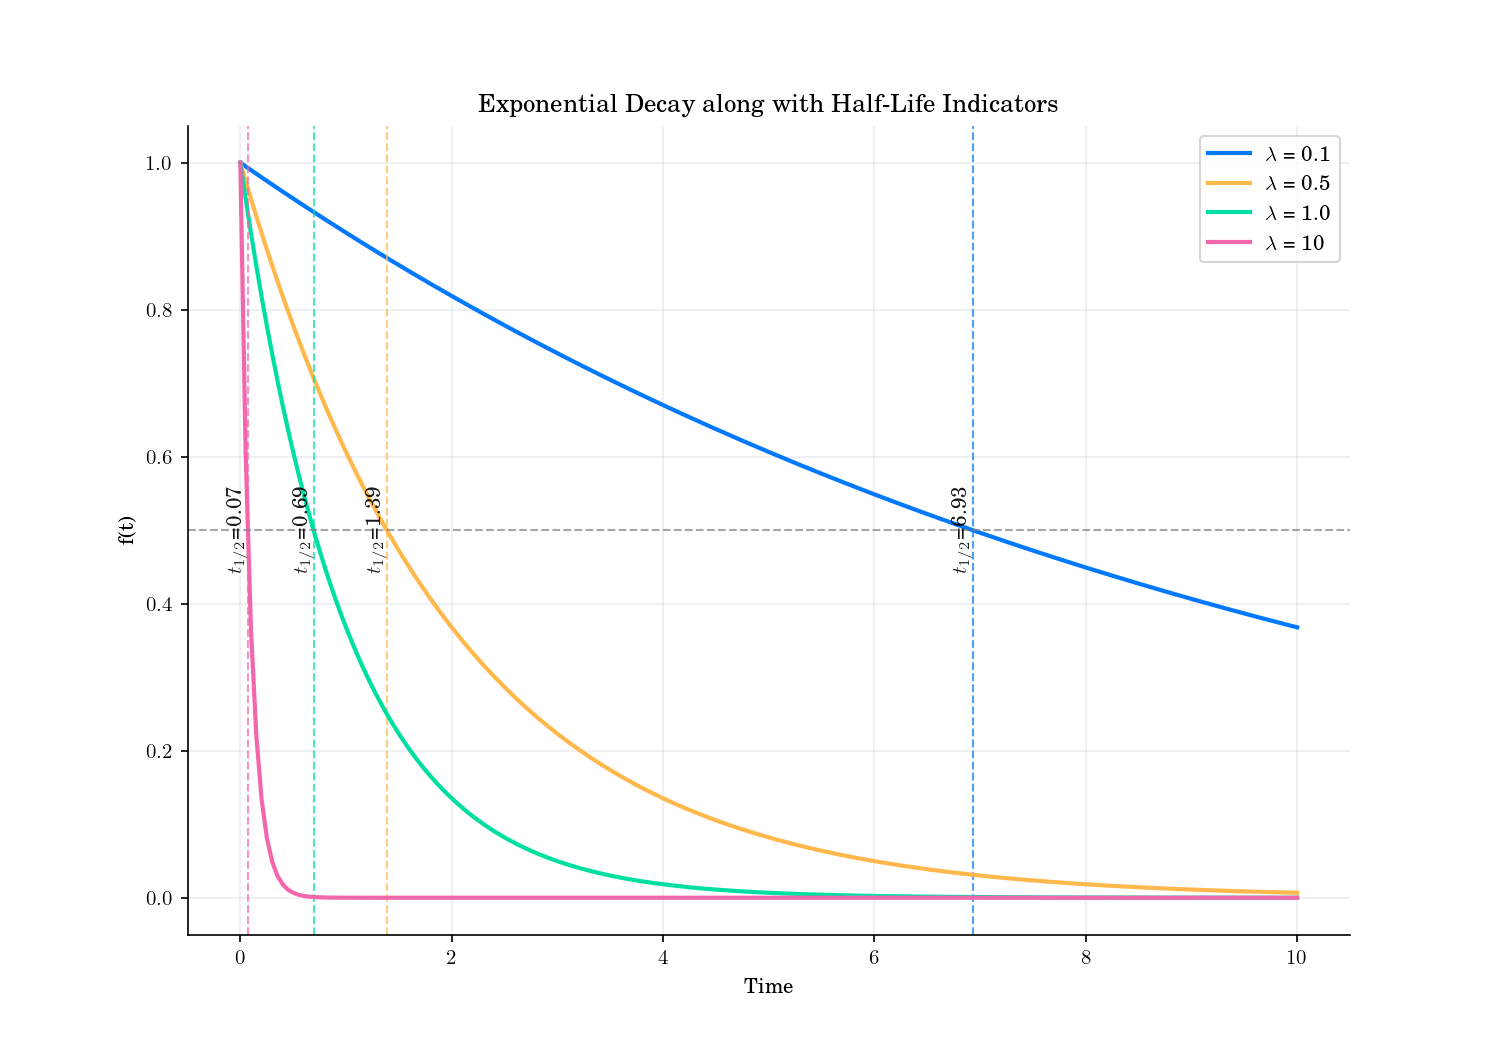
half_life_values = [np.log(2)/lam for lam in lambda_values]
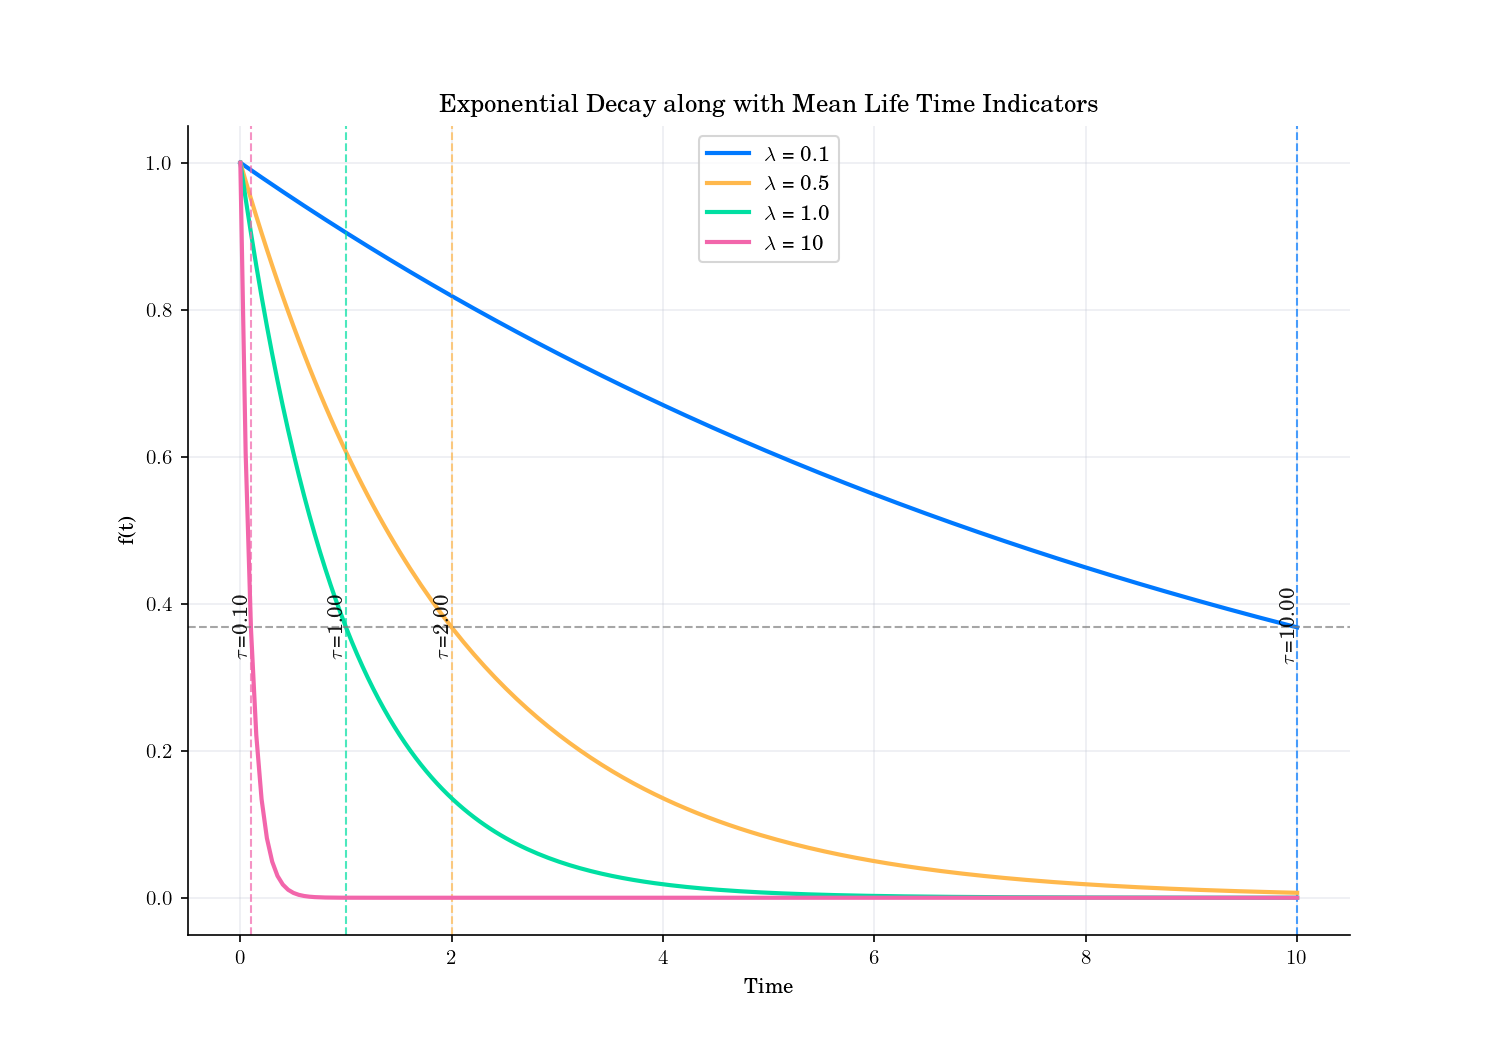
mean_life_values = [1/lam for lam in lambda_values]
fig, ax = plt.subplots(dpi=150, figsize=(10, 7))
for lam in lambda_values:
N_t = np.exp(-lam * t)
label = rf"$\lambda$ = {lam}"
ax.plot(t, N_t, label=label, linewidth=2)
ax.set_xlabel("Time")
ax.set_ylabel("f(t)")
ax.set_title("Exponential Decay for Different Decay Rates")
ax.legend()
ax.grid(alpha=0.3, linestyle='-')
plt.show()
fig, ax = plt.subplots(dpi=150, figsize=(10, 7))
for lam in lambda_values:
N_t = np.exp(-lam * t)
label = rf"$\lambda$ = {lam}"
ax.plot(t, N_t, label=label, linewidth=2)
ax.axvline(1/lam, linestyle='--', alpha=0.7,color=plt.gca().lines[-1].get_color())
ax.text(1/lam, 1/np.e, rf"$\tau$={1/lam:.2f}", rotation=90,
verticalalignment='center', horizontalalignment='right', color='black', alpha=0.9)
ax.axhline(1/np.e, linestyle='--', alpha=0.7,color='gray')
ax.set_xlabel("Time")
ax.set_ylabel("f(t)")
ax.set_title("Exponential Decay along with Mean Life Time Indicators")
ax.legend()
ax.grid(alpha=0.3, linestyle='-')
plt.show()
fig, ax = plt.subplots(dpi=150, figsize=(10, 7))
for lam in lambda_values:
N_t = np.exp(-lam * t)
label = rf"$\lambda$ = {lam}"
ax.plot(t, N_t, label=label, linewidth=2)
ax.axvline(np.log(2)/lam, linestyle='--', alpha=0.7,color=plt.gca().lines[-1].get_color())
ax.text(np.log(2)/lam, 0.5, rf"$t_{{1/2}}$={np.log(2)/lam:.2f}", rotation=90,
verticalalignment='center', horizontalalignment='right', color='black', alpha=0.9)
ax.axhline(0.5, linestyle='--', alpha=0.7,color='gray')
ax.set_xlabel("Time")
ax.set_ylabel("f(t)")
ax.set_title("Exponential Decay along with Half-Life Indicators")
ax.legend()
ax.grid(alpha=0.3, linestyle='-')
plt.show()
Total running time of the script: (0 minutes 2.852 seconds)