Note
Go to the end to download the full example code.
Correlation#
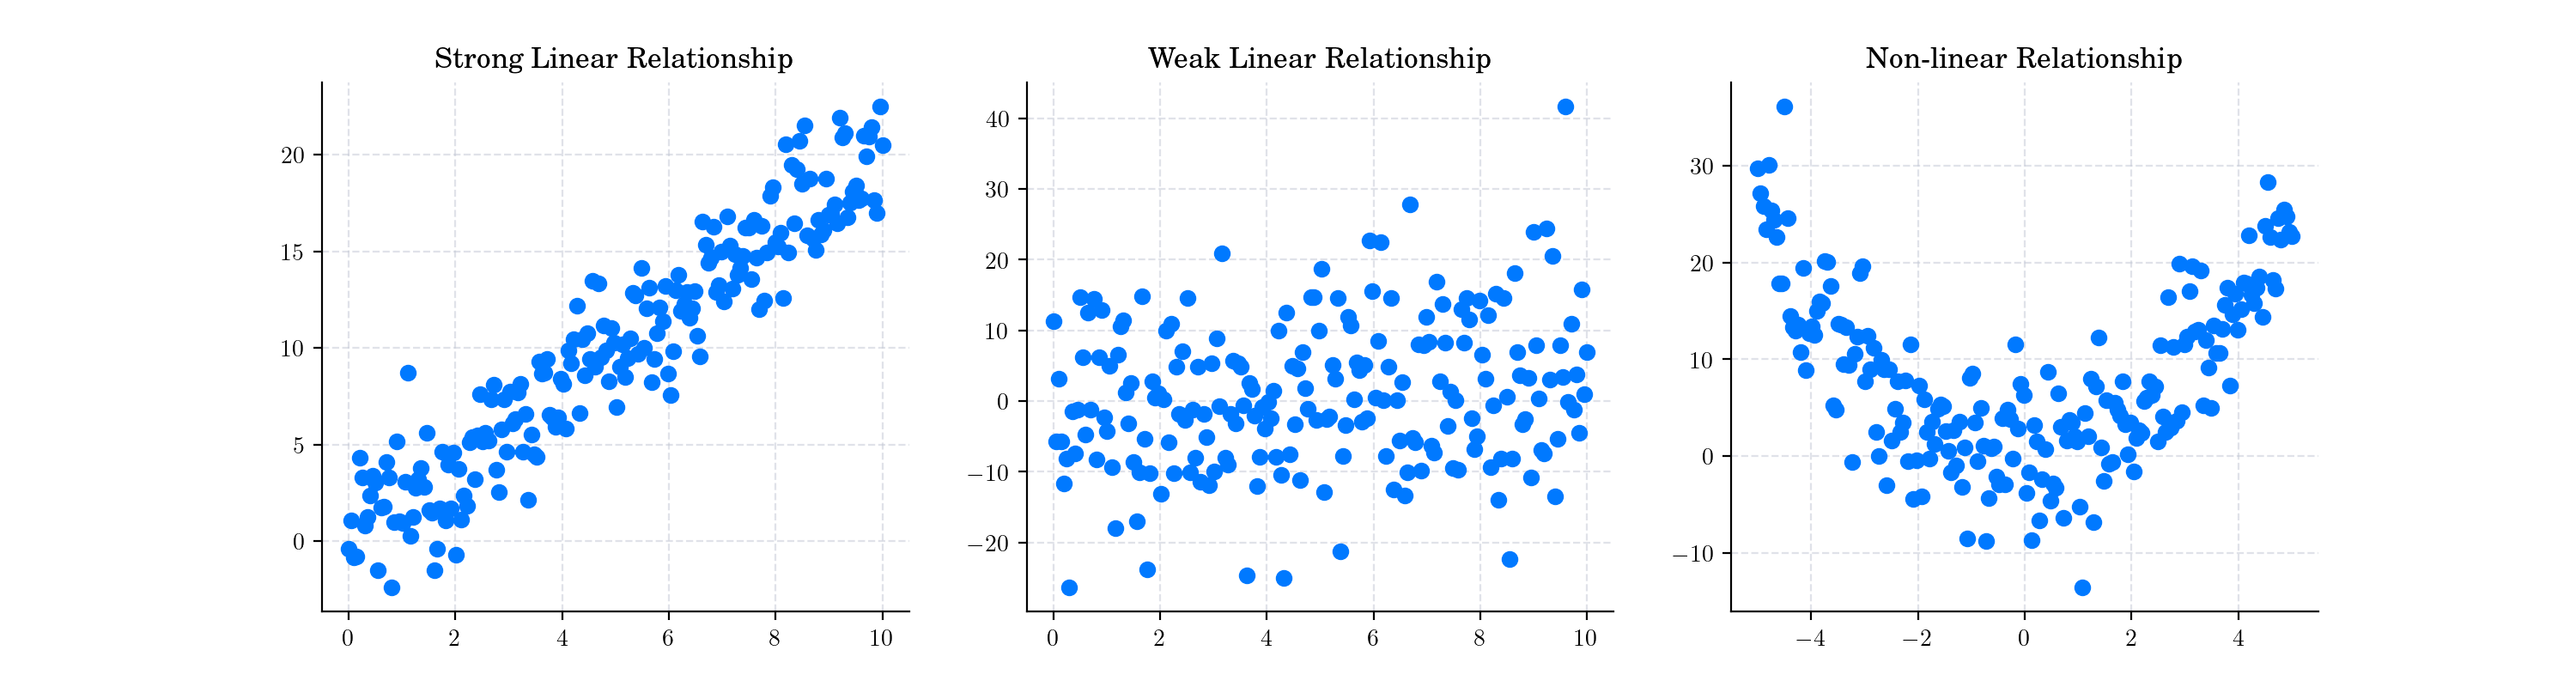
Strong Linear data
 Pearson Correlation: 0.9452991322773132
 Spearman Correlation: 0.9503532588314709
 Kendall Tau: 0.7990954773869346

Weak linear data
 Pearson Correlation: 0.19507661957548816
 Spearman Correlation: 0.16760219005475138
 Kendall Tau: 0.11125628140703517

Non-linear quadratic data
 Pearson Correlation: 0.007220503653477846
 Spearman Correlation: 0.029063226580664524
 Kendall Tau: 0.024623115577889446
# Author: Dialid Santiago <d.santiago@outlook.com>
# License: MIT
# Description: Advent Calendar 2025 - Plot Pearson Correlation


import numpy as np
import matplotlib.pyplot as plt
from scipy.stats import pearsonr, spearmanr, kendalltau

plt.style.use("https://raw.githubusercontent.com/quantgirluk/matplotlib-stylesheets/main/quant-pastel-light.mplstyle")


import numpy as np
from scipy.stats import pearsonr, spearmanr
import matplotlib.pyplot as plt

np.random.seed(12345)

# Linear relationship
x_lin = np.linspace(0, 10, 200)
y_lin = 2 * x_lin + np.random.normal(0, 2, size=len(x_lin))
y_lin_weak = 0.25 * x_lin + np.random.normal(0, 10, size=len(x_lin))

# Non-linear (quadratic) relationship
x_quad = np.linspace(-5, 5, 200)
y_quad = x_quad**2 + np.random.normal(0, 5, size=len(x_quad))


def report(name, x, y):
    print(f"\n{name}")
    print(" Pearson Correlation:", pearsonr(x, y)[0])
    print(" Spearman Correlation:", spearmanr(x, y)[0])
    print(" Kendall Tau:", kendalltau(x, y)[0])

report("Strong Linear data", x_lin, y_lin)
report("Weak linear data", x_lin, y_lin_weak)
report("Non-linear quadratic data", x_quad, y_quad)

fig, ax = plt.subplots(1, 3, figsize=(15,4), dpi=200)
ax[0].scatter(x_lin, y_lin)
ax[0].set_title("Strong Linear Relationship")

ax[1].scatter(x_lin, y_lin_weak)
ax[1].set_title("Weak Linear Relationship")

ax[2].scatter(x_quad, y_quad)
ax[2].set_title("Non-linear Relationship")

plt.show()
Total running time of the script: (0 minutes 1.668 seconds)