Day 3: Yield Curves#
“Any time the yield curve flattens or inverts, that’s really bad news for the banking system.”
—Campbell Harvey, Economist
In finance, the yield curve is a graph which depicts how the yields on debt instruments – such as bonds – vary as a function of their years remaining to maturity.
The yield curve shows how much it costs the federal government to borrow money for a given amount of time, revealing the relationship between long- and short-term interest rates.

Ronald Melicher and Merle Welshans have identified several characteristics of a properly constructed yield curve.
It should be based on a set of securities which have differing lengths of time to maturity,
All yields should be calculated as of the same point in time,
All securities measured in the yield curve should have similar credit ratings, to screen out the effect of yield differentials caused by credit risk.
For this reason, many traders closely watch the yield curve for U.S. Treasury (Bank of England in the UK) debt securities, which are considered to be risk-free.
Historical values for the yield curve can be visualized using a 3D surface plot or a Heatmap, showing how yields have changed over time across different maturities.
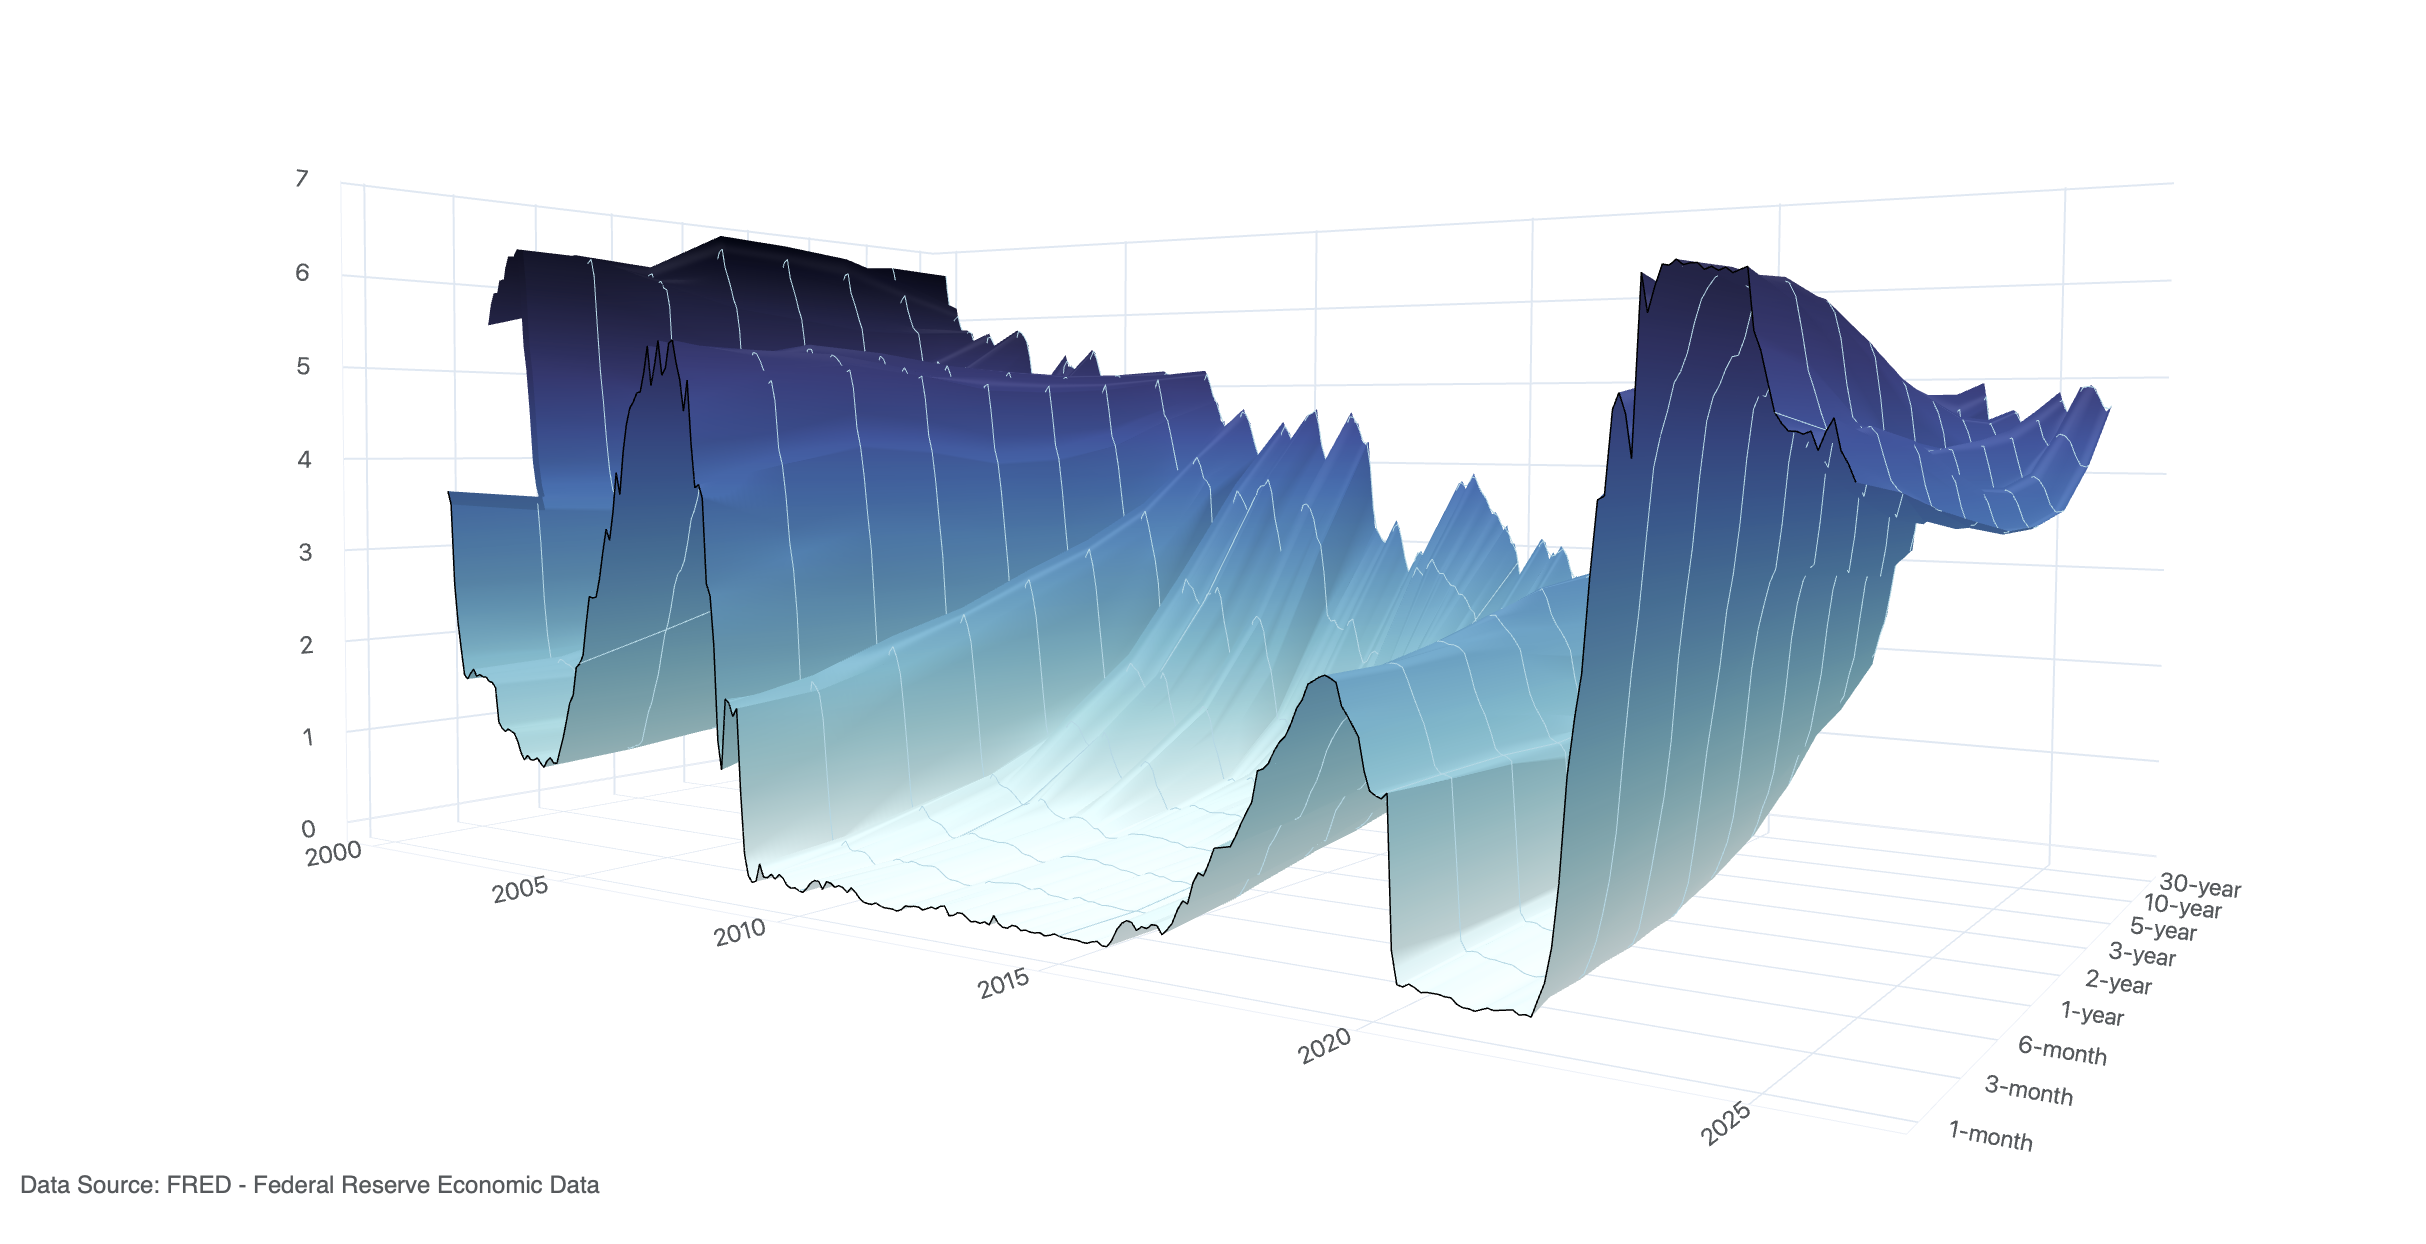
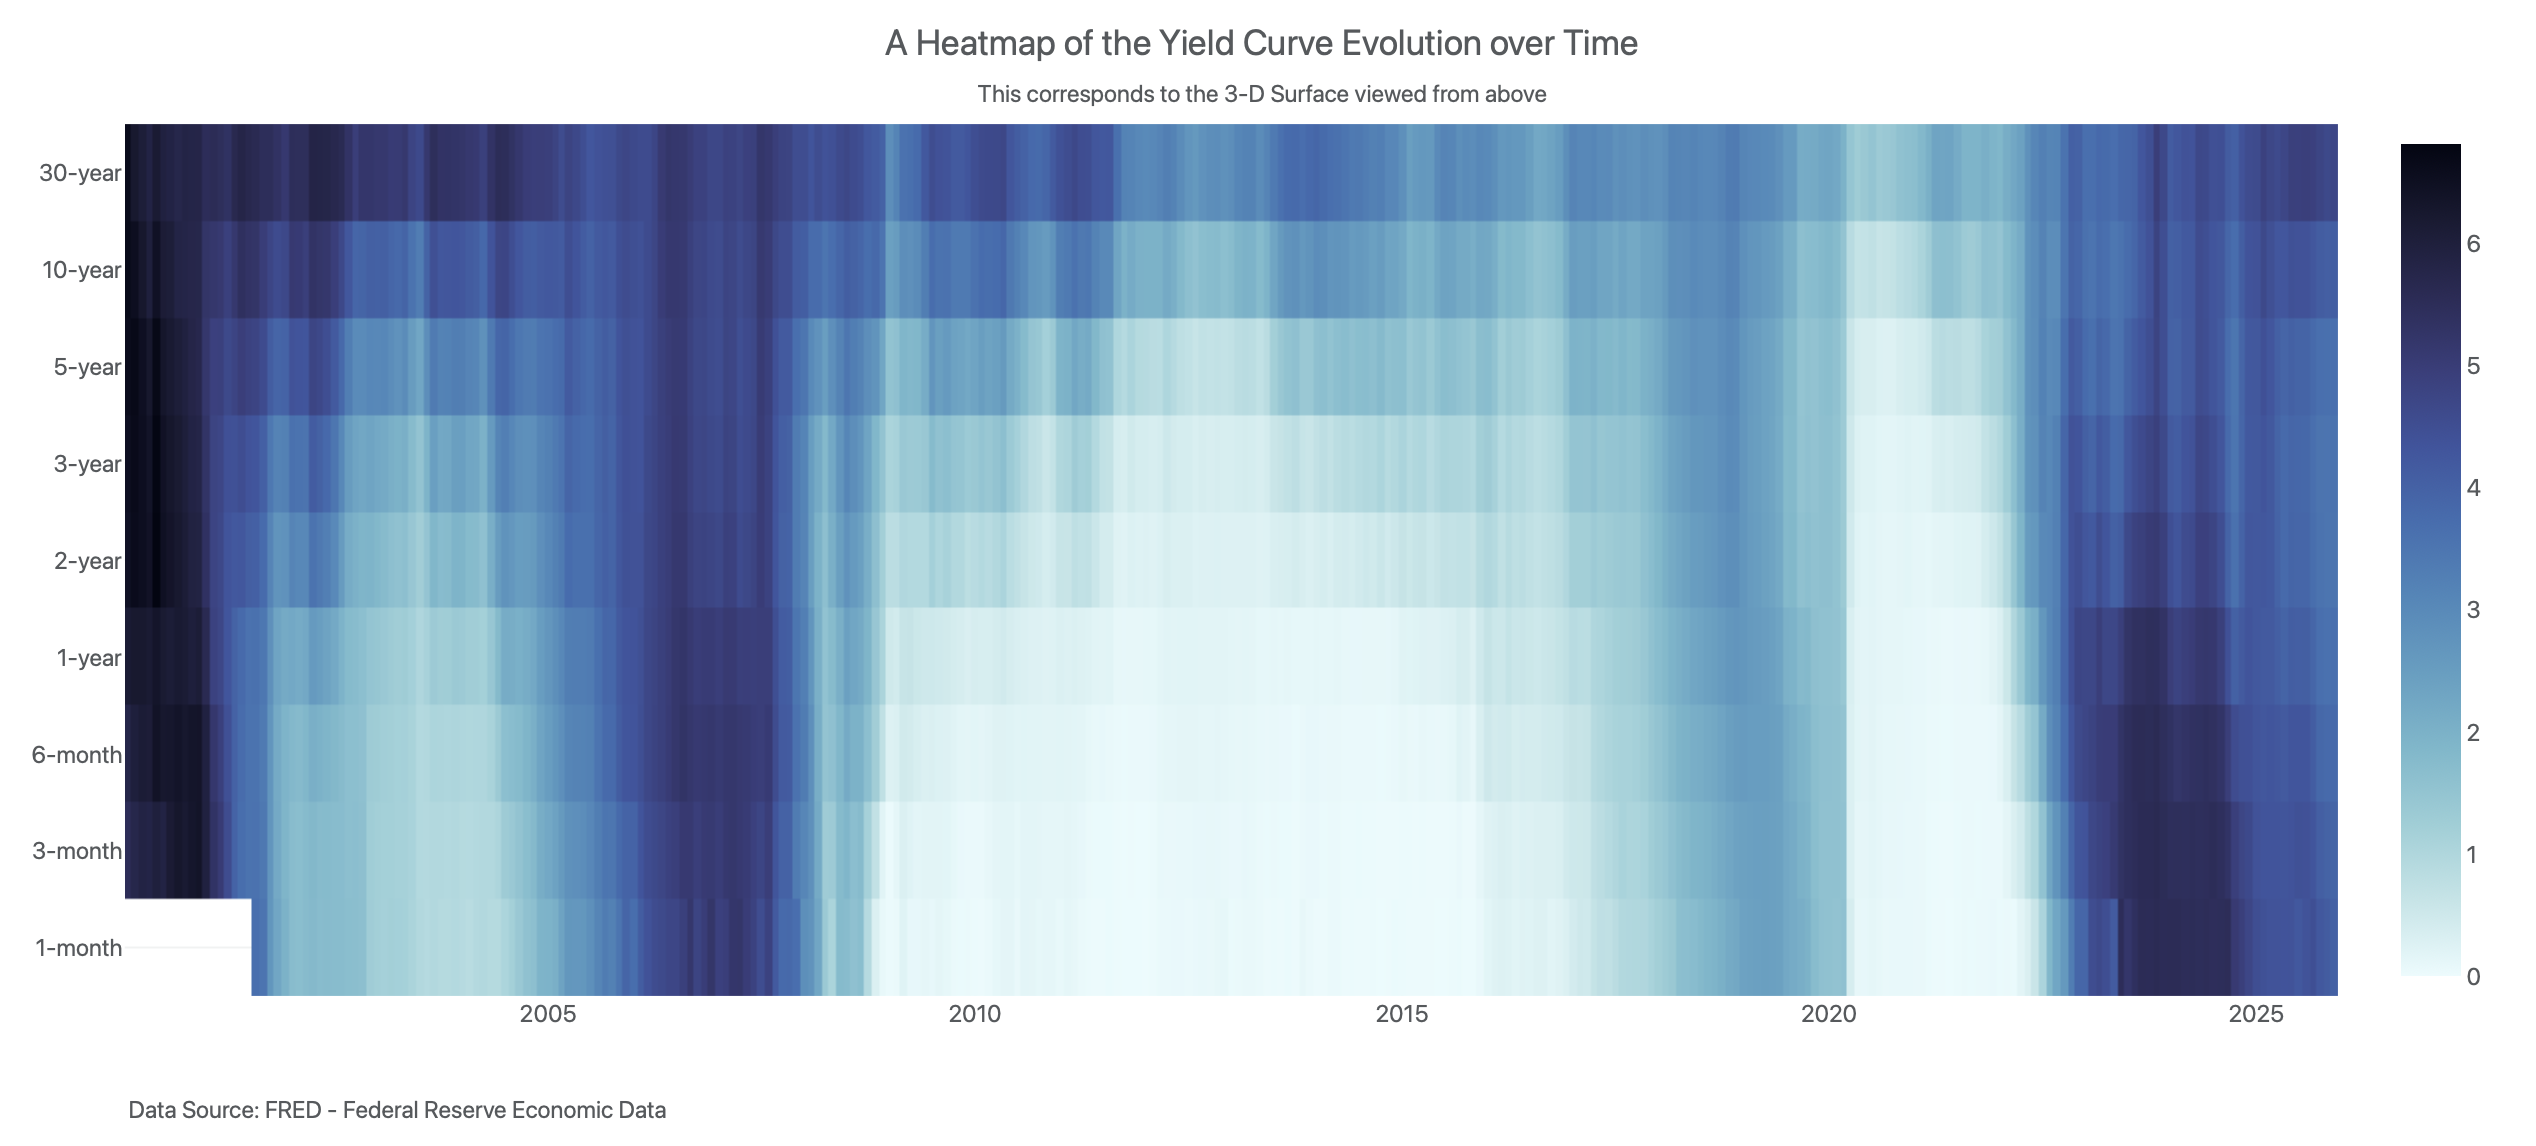
Yield curve surface. Source: Federal Reserve Bank of St. Louis.
For a full interactive version of the plots above, visit my GitHub Repo Yield-Curves-Visual.
Shapes#
There are three primary shapes of yield curves: normal (upward sloping), inverted (downward sloping), and flat.
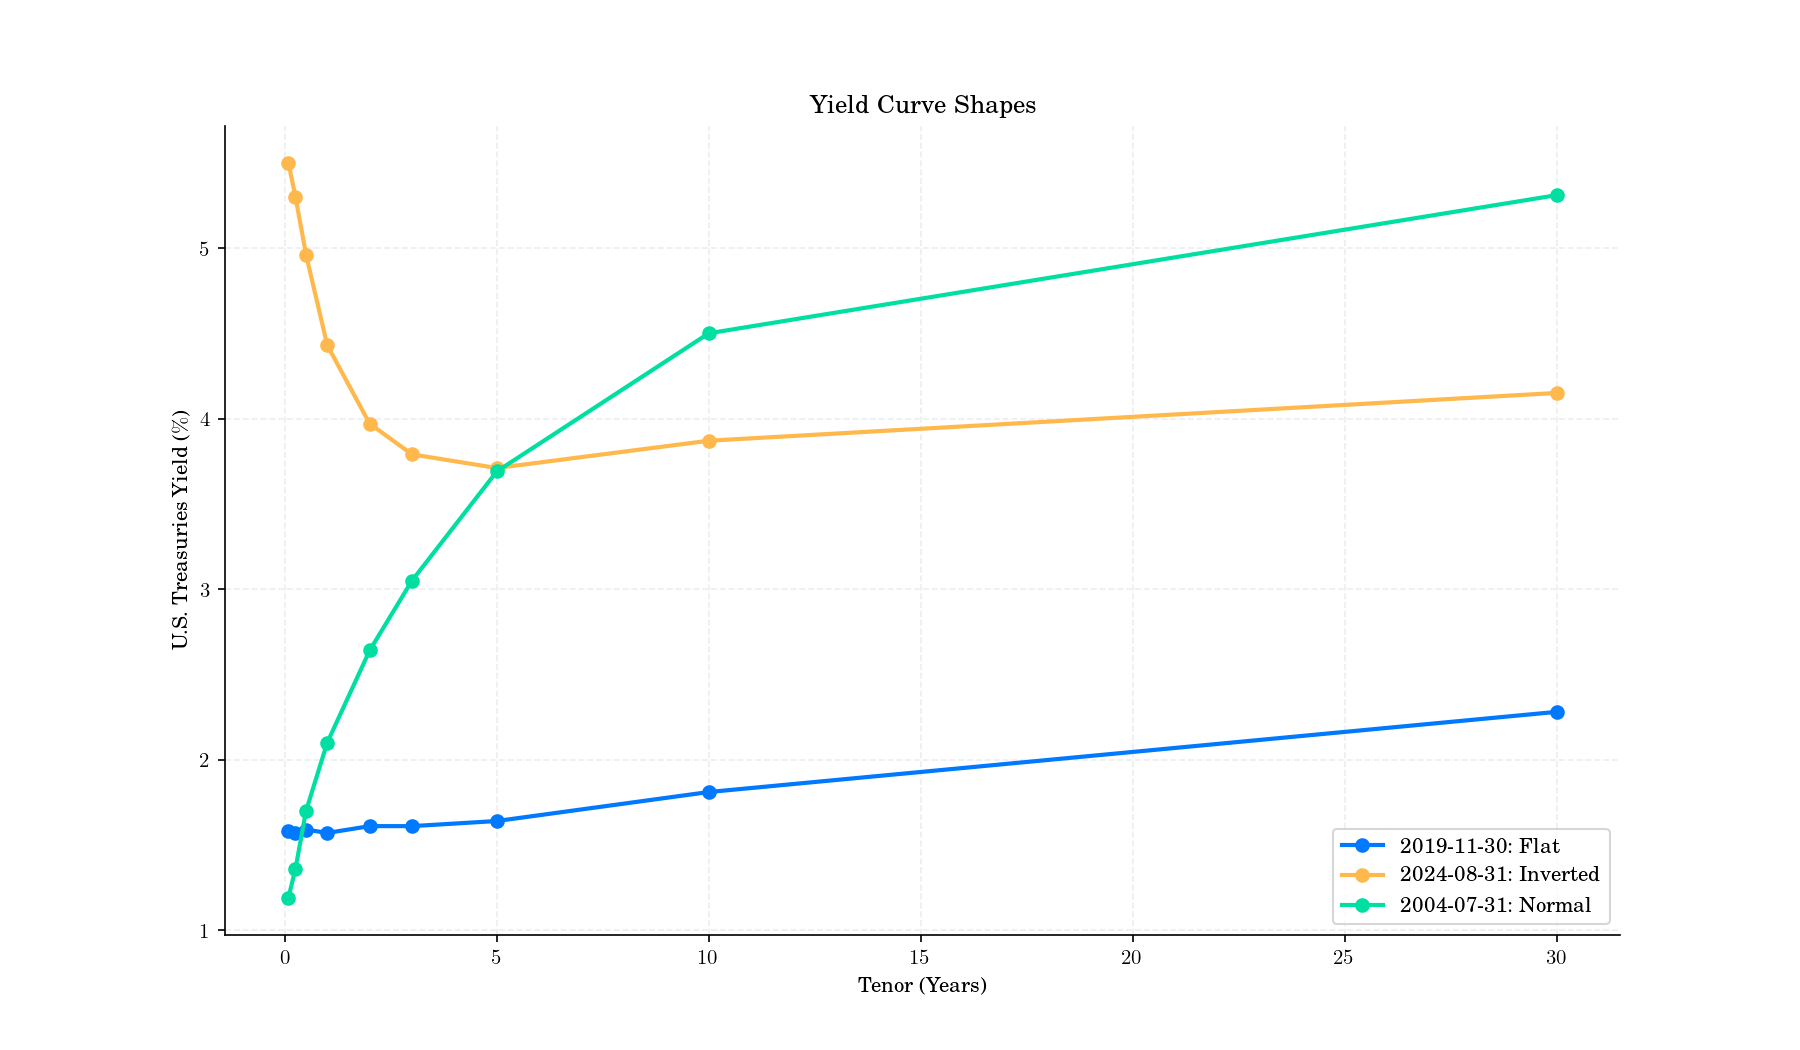
Source: Federal Reserve Bank of St. Louis.
A normal yield curve indicates that longer-term debt instruments have higher yields than short-term ones, reflecting expectations of economic growth and inflation.
An inverted yield curve is observed when short-term yields exceed long-term yields. This scenario is often seen as a predictor of economic recession. It implies that the market believes inflation will remain low. This is because, even if there is a recession, a low bond yield will still be offset by low inflation.
A flat yield curve is observed when all maturities have similar yields, whereas a humped curve results when short-term and long-term yields are equal and medium-term yields are higher than those of the short-term and long-term. A flat curve sends signals of uncertainty in the economy. This mixed signal can revert to a normal curve or could later result into an inverted curve.
Random Facts#
The yield has its origins after August 15, 1971, when US President Richard Nixon ended the dollar’s link to gold and brought in floating exchange rates. Interest rates became more volatile, and bond traders (particulary at Salomon Brothers under the encouragement of Marty Liebowitz) began plotting yields across maturities as a single curve rather than treating each bond as its own market. This is where the familiar language of the short end and long end took hold!
Academics tried to formalise what practicioners were already doing. In 1977, Vasicek introduced one of the first mathematical models of the term structure, showing how movements in the short rate can drive bond prices across the curve. His model was followed by many others such as Hull-White, Cox-Ingersoll-Ross (CIR), and ultimately by the Heath-Jarrow-Morton (HJM) framework, which directly models the entire forward-rate curve.
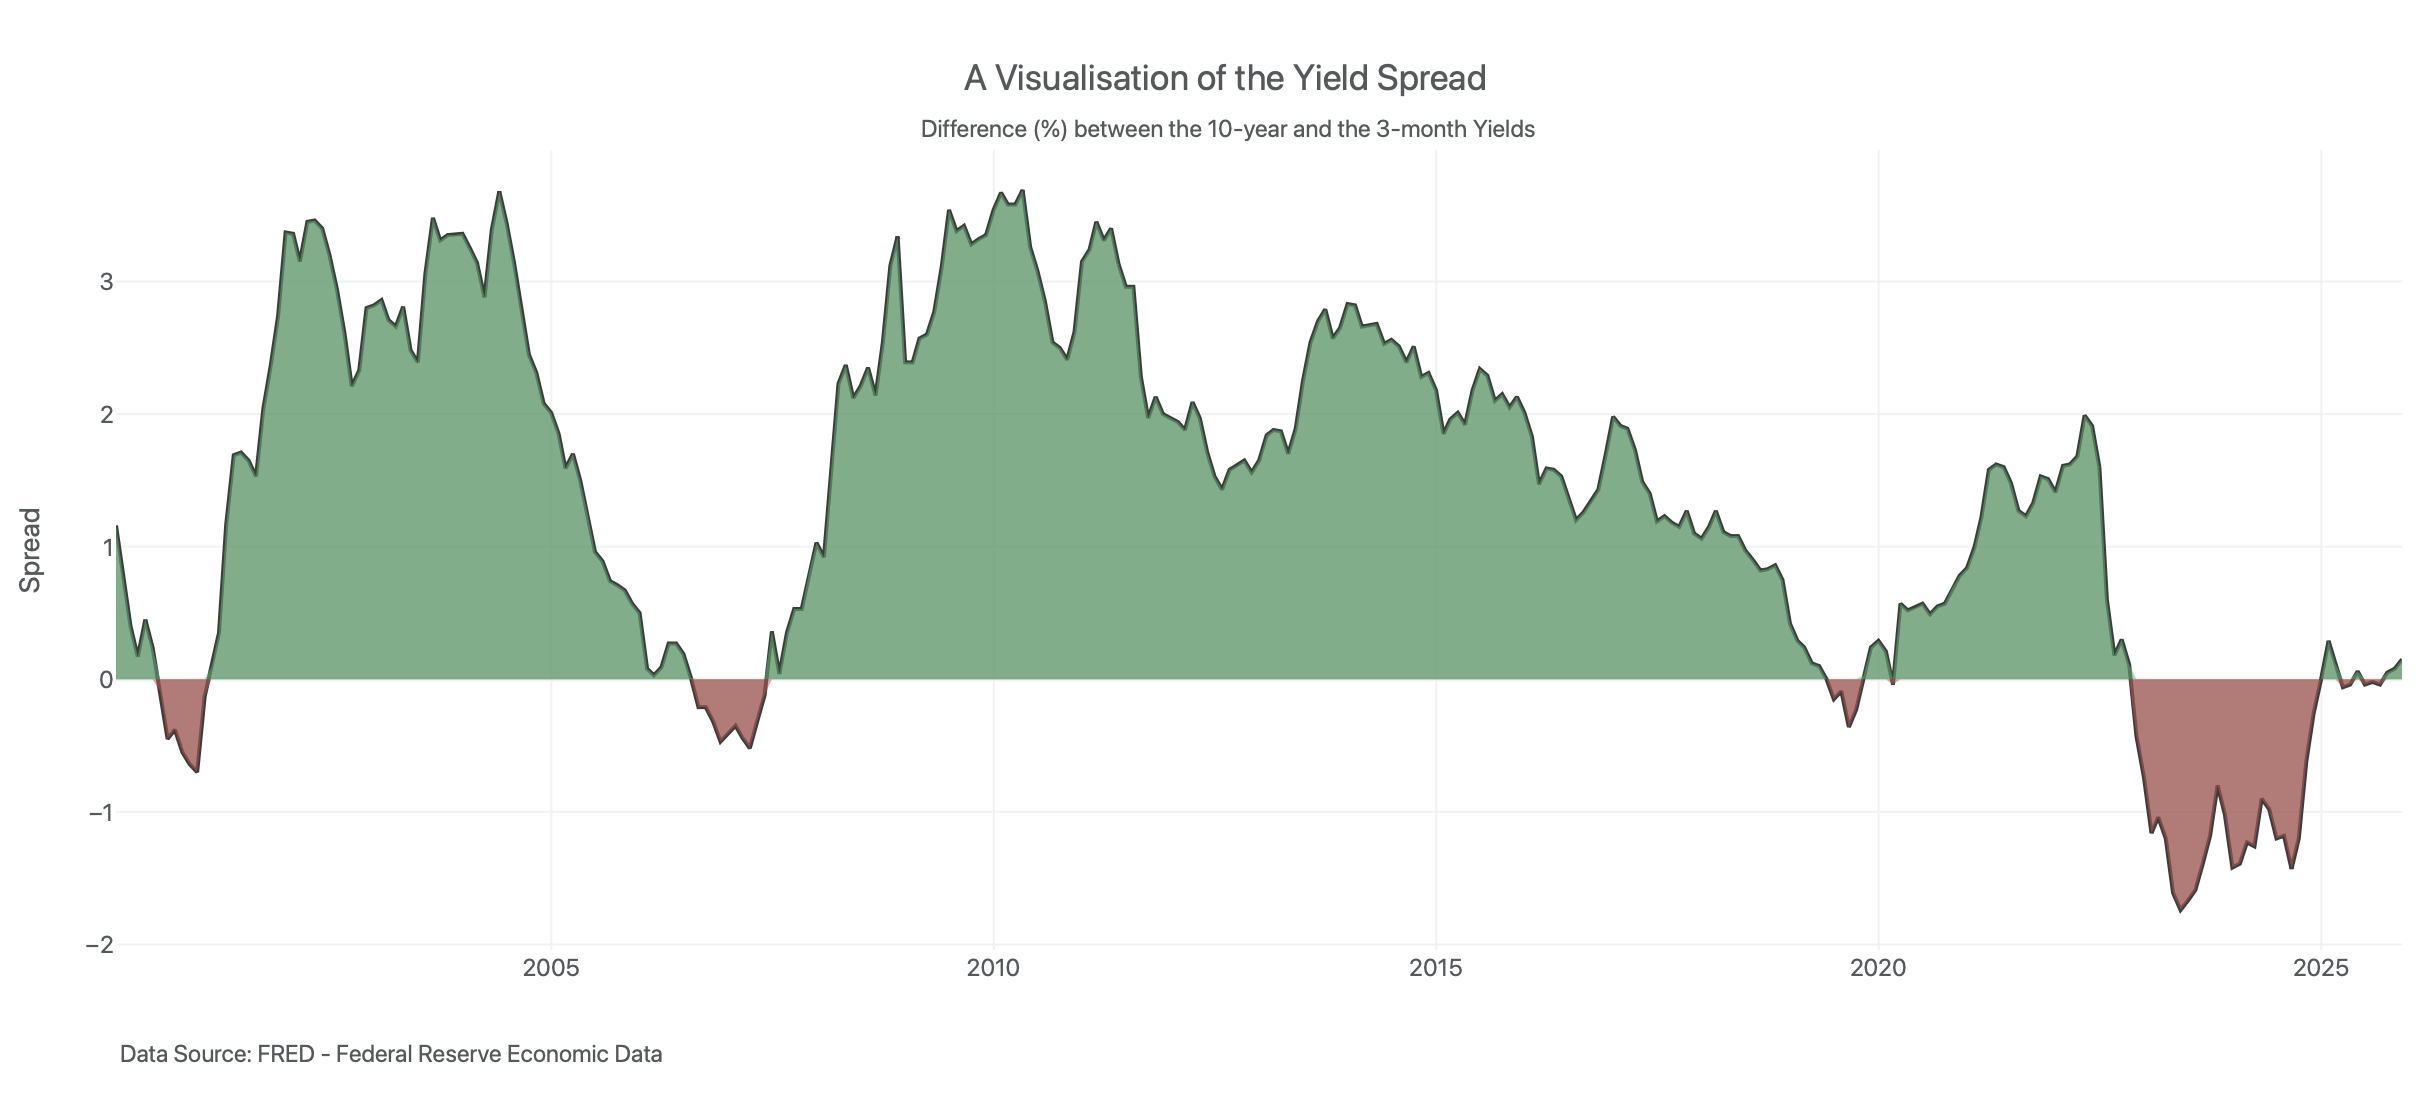
An inverted yield curve is often interpreted as an indicator of recession. Work by Arturo Estrella and Tobias Adrian has established the predictive power of an inverted yield curve to signal a recession. Their models show that when the difference between short-term interest rates (they use 3-month T-bills) and long-term interest rates (10-year Treasury bonds) at the end of a federal reserve tightening cycle is negative or less than 93 basis points positive, a rise in unemployment usually occurs.
Inflation impact on purcharsing power. Source: BoE Inflation Calculator.#
The New York Fed publishes a monthly recession probability prediction derived from the yield curve and based on Estrella’s work. You can find it here.
Yield curves are built from either prices available in the bond market or the money market.