Day 8 : Normality Testing#
“All models are wrong, but some are useful.”
—George E. P. Box, Statistician
In statistics and data analysis, the assumption of normality is foundational for many techniques, including hypothesis testing, regression analysis, and ANOVA. However, real-world data often deviates from the ideal of a normal distribution. This is where normality testing comes into play. Normality tests help us assess whether our data follows a normal distribution, guiding our choice of statistical methods and ensuring the validity of our conclusions.
Commonly used tests to assess normality are:
Shapiro-Wilk Test: This test is particularly powerful for small sample sizes. It tests the null hypothesis that the data is normally distributed. A low p-value (typically < 0.05) indicates a departure from normality.
Kolmogorov-Smirnov Test: This test compares the empirical distribution of the data with the expected normal distribution. It is more general but less powerful than the Shapiro-Wilk test.
Anderson-Darling Test: This test gives more weight to the tails of the distribution, making it sensitive to deviations in the extremes. It provides critical values for different significance levels.
In addition to these formal tests, graphical methods can also be employed:
Q-Q Plot (Quantile-Quantile Plot): While not a formal test, a Q-Q plot is a graphical tool that helps visualize how closely the data follows a normal distribution. Points that fall along a straight line indicate normality.
Histogram and Density Plots: Visual inspection of histograms and density plots can provide insights into the distribution of the data, although they are subjective and less precise than formal tests.
Empirical CDF Plot: Comparing the empirical cumulative distribution function (CDF) of the data with the theoretical CDF of a normal distribution can also help assess normality visually.
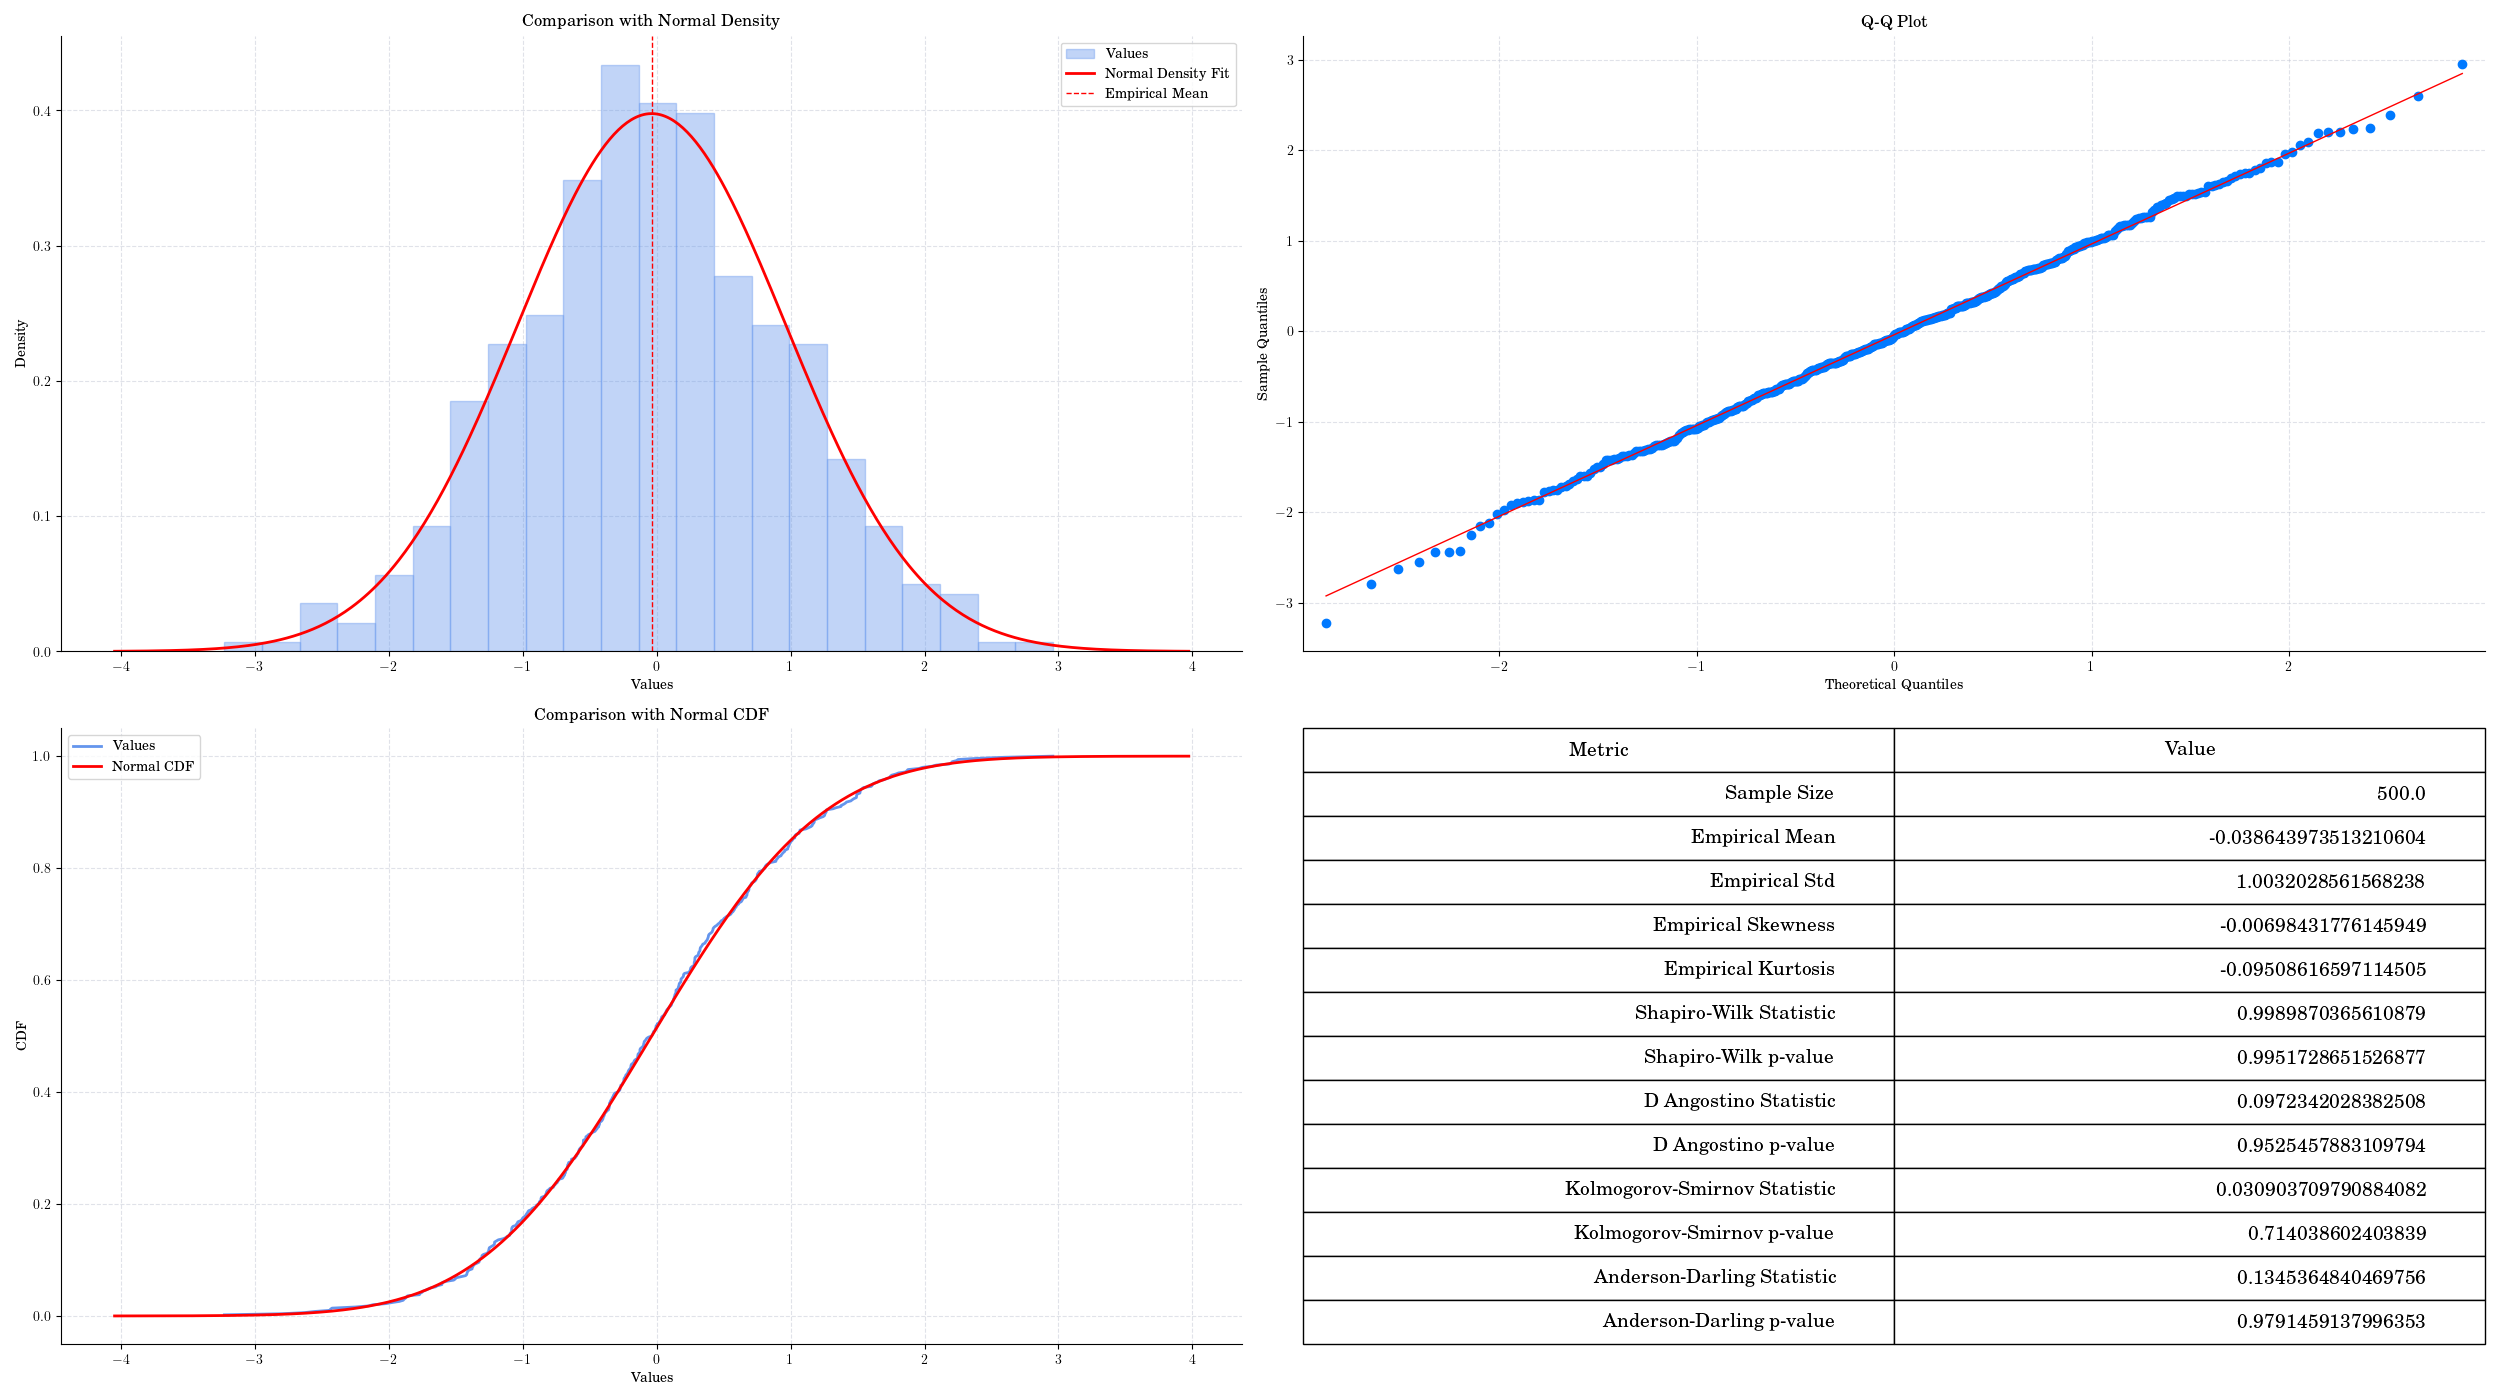
Normality Testing on sample data from a Normal distribution.#
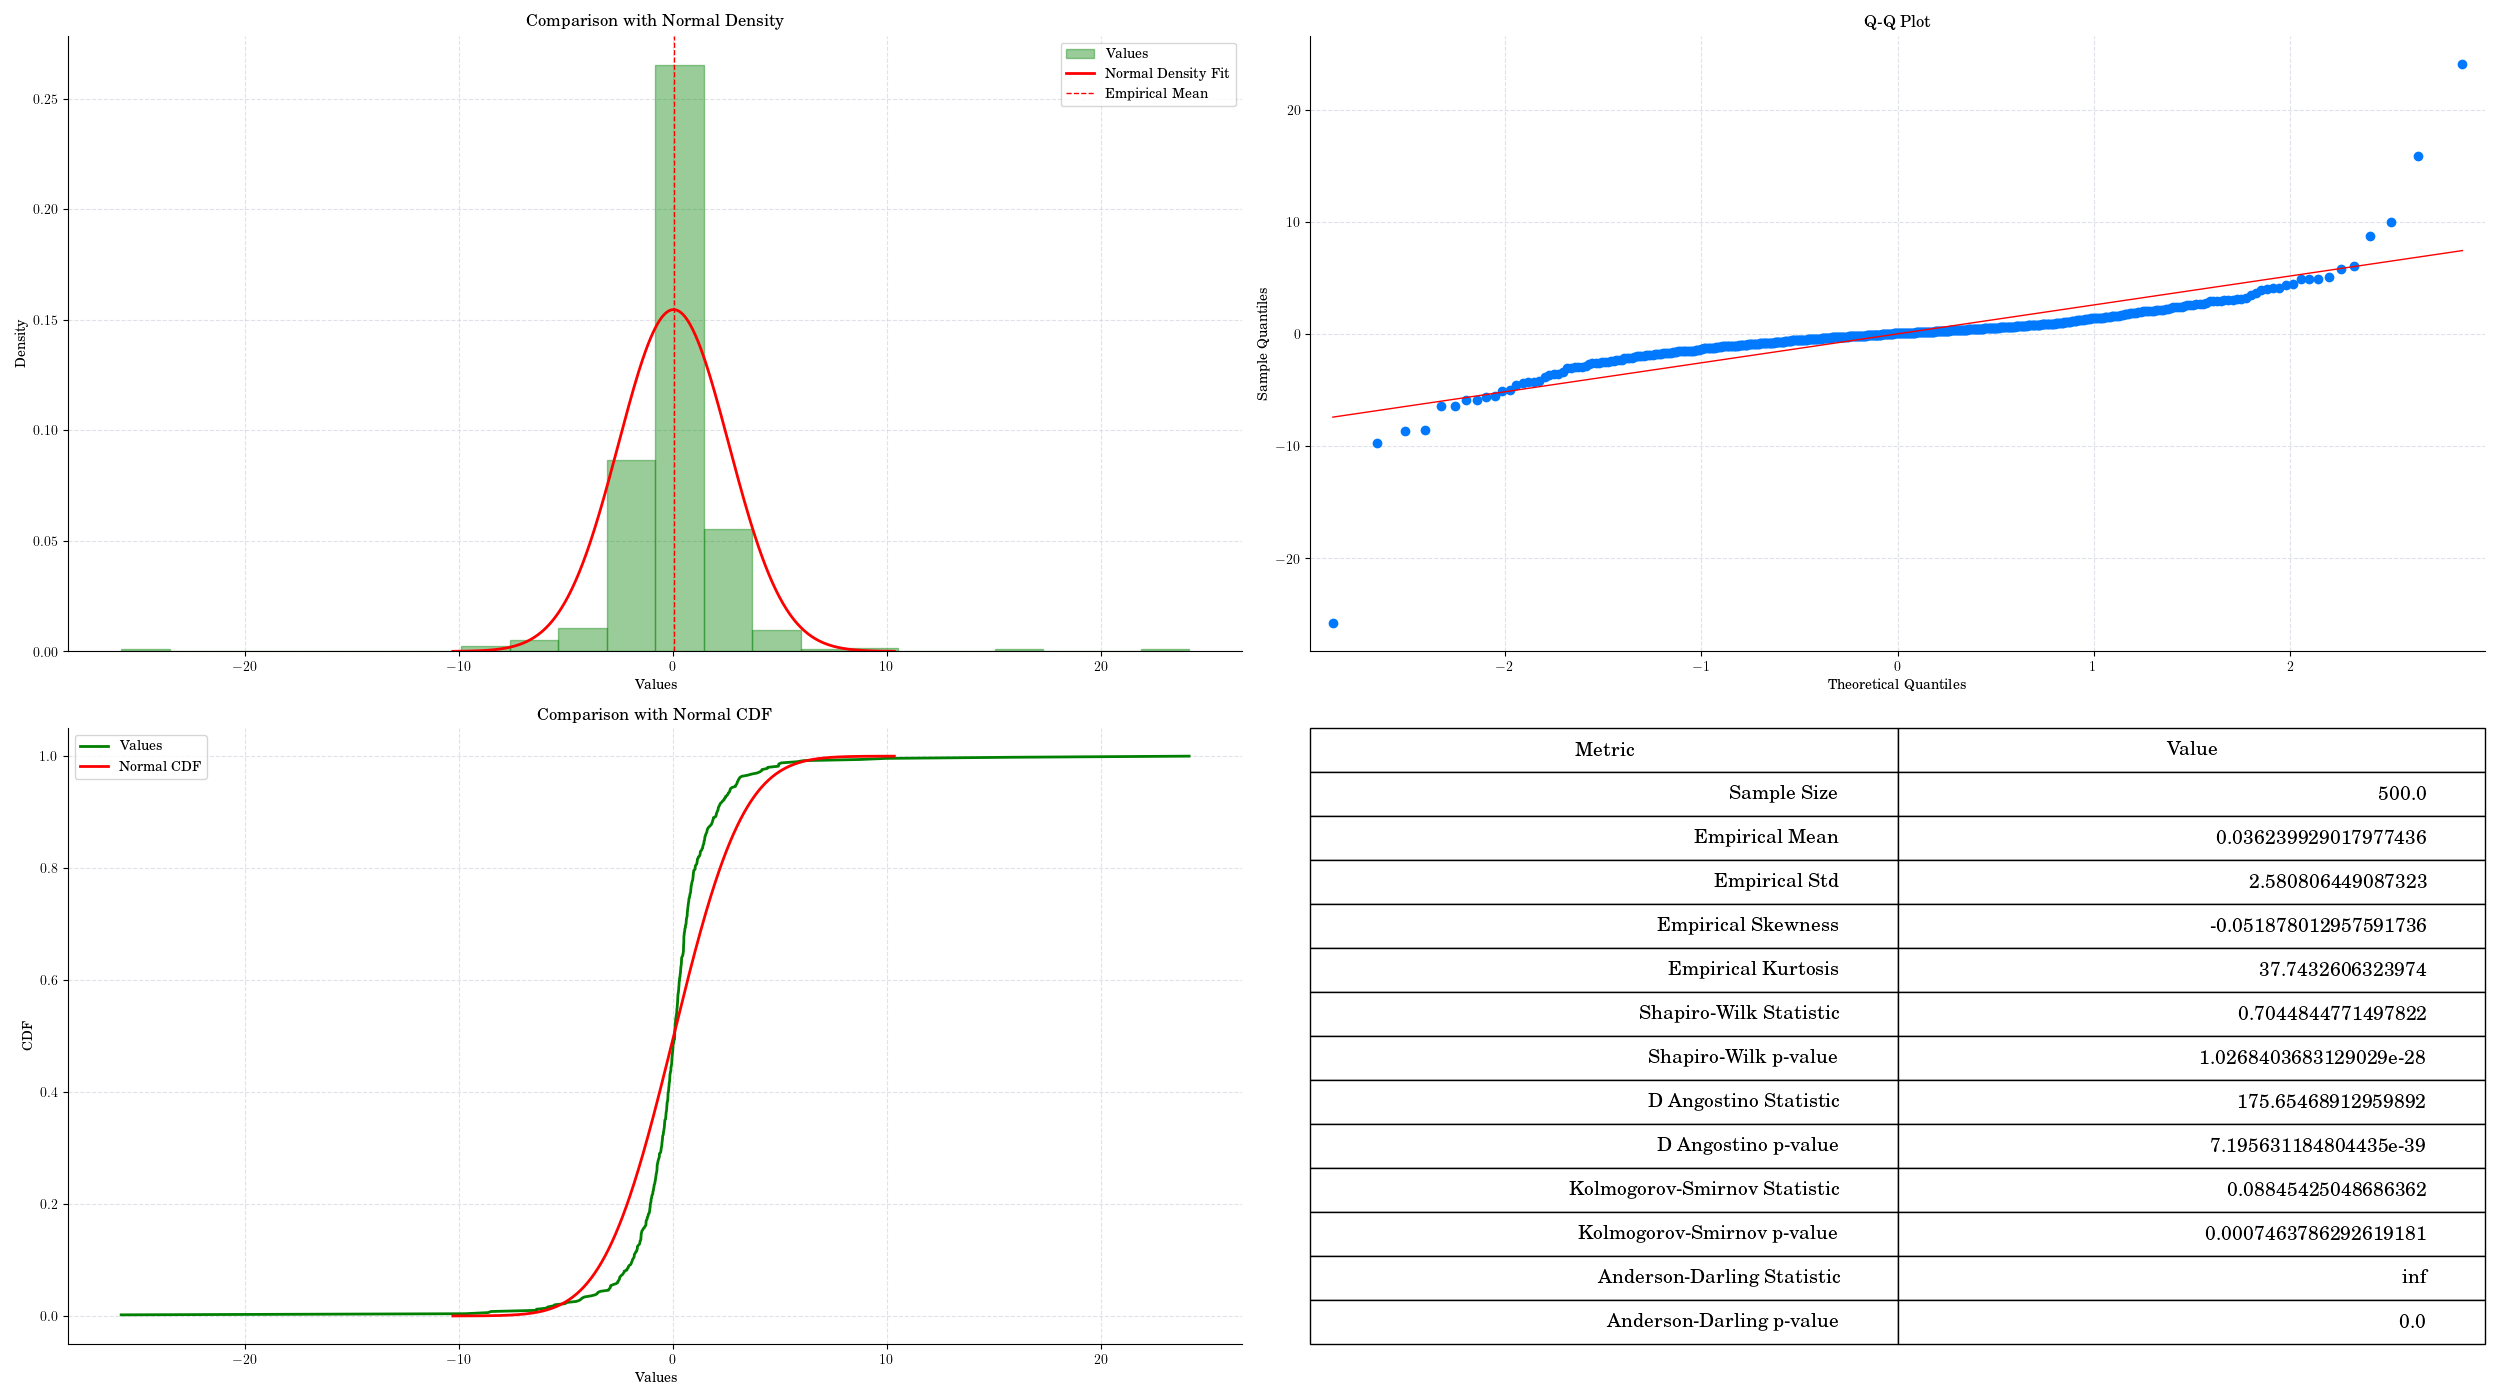
Normality Testing on sample data from a Student-t distribution.#
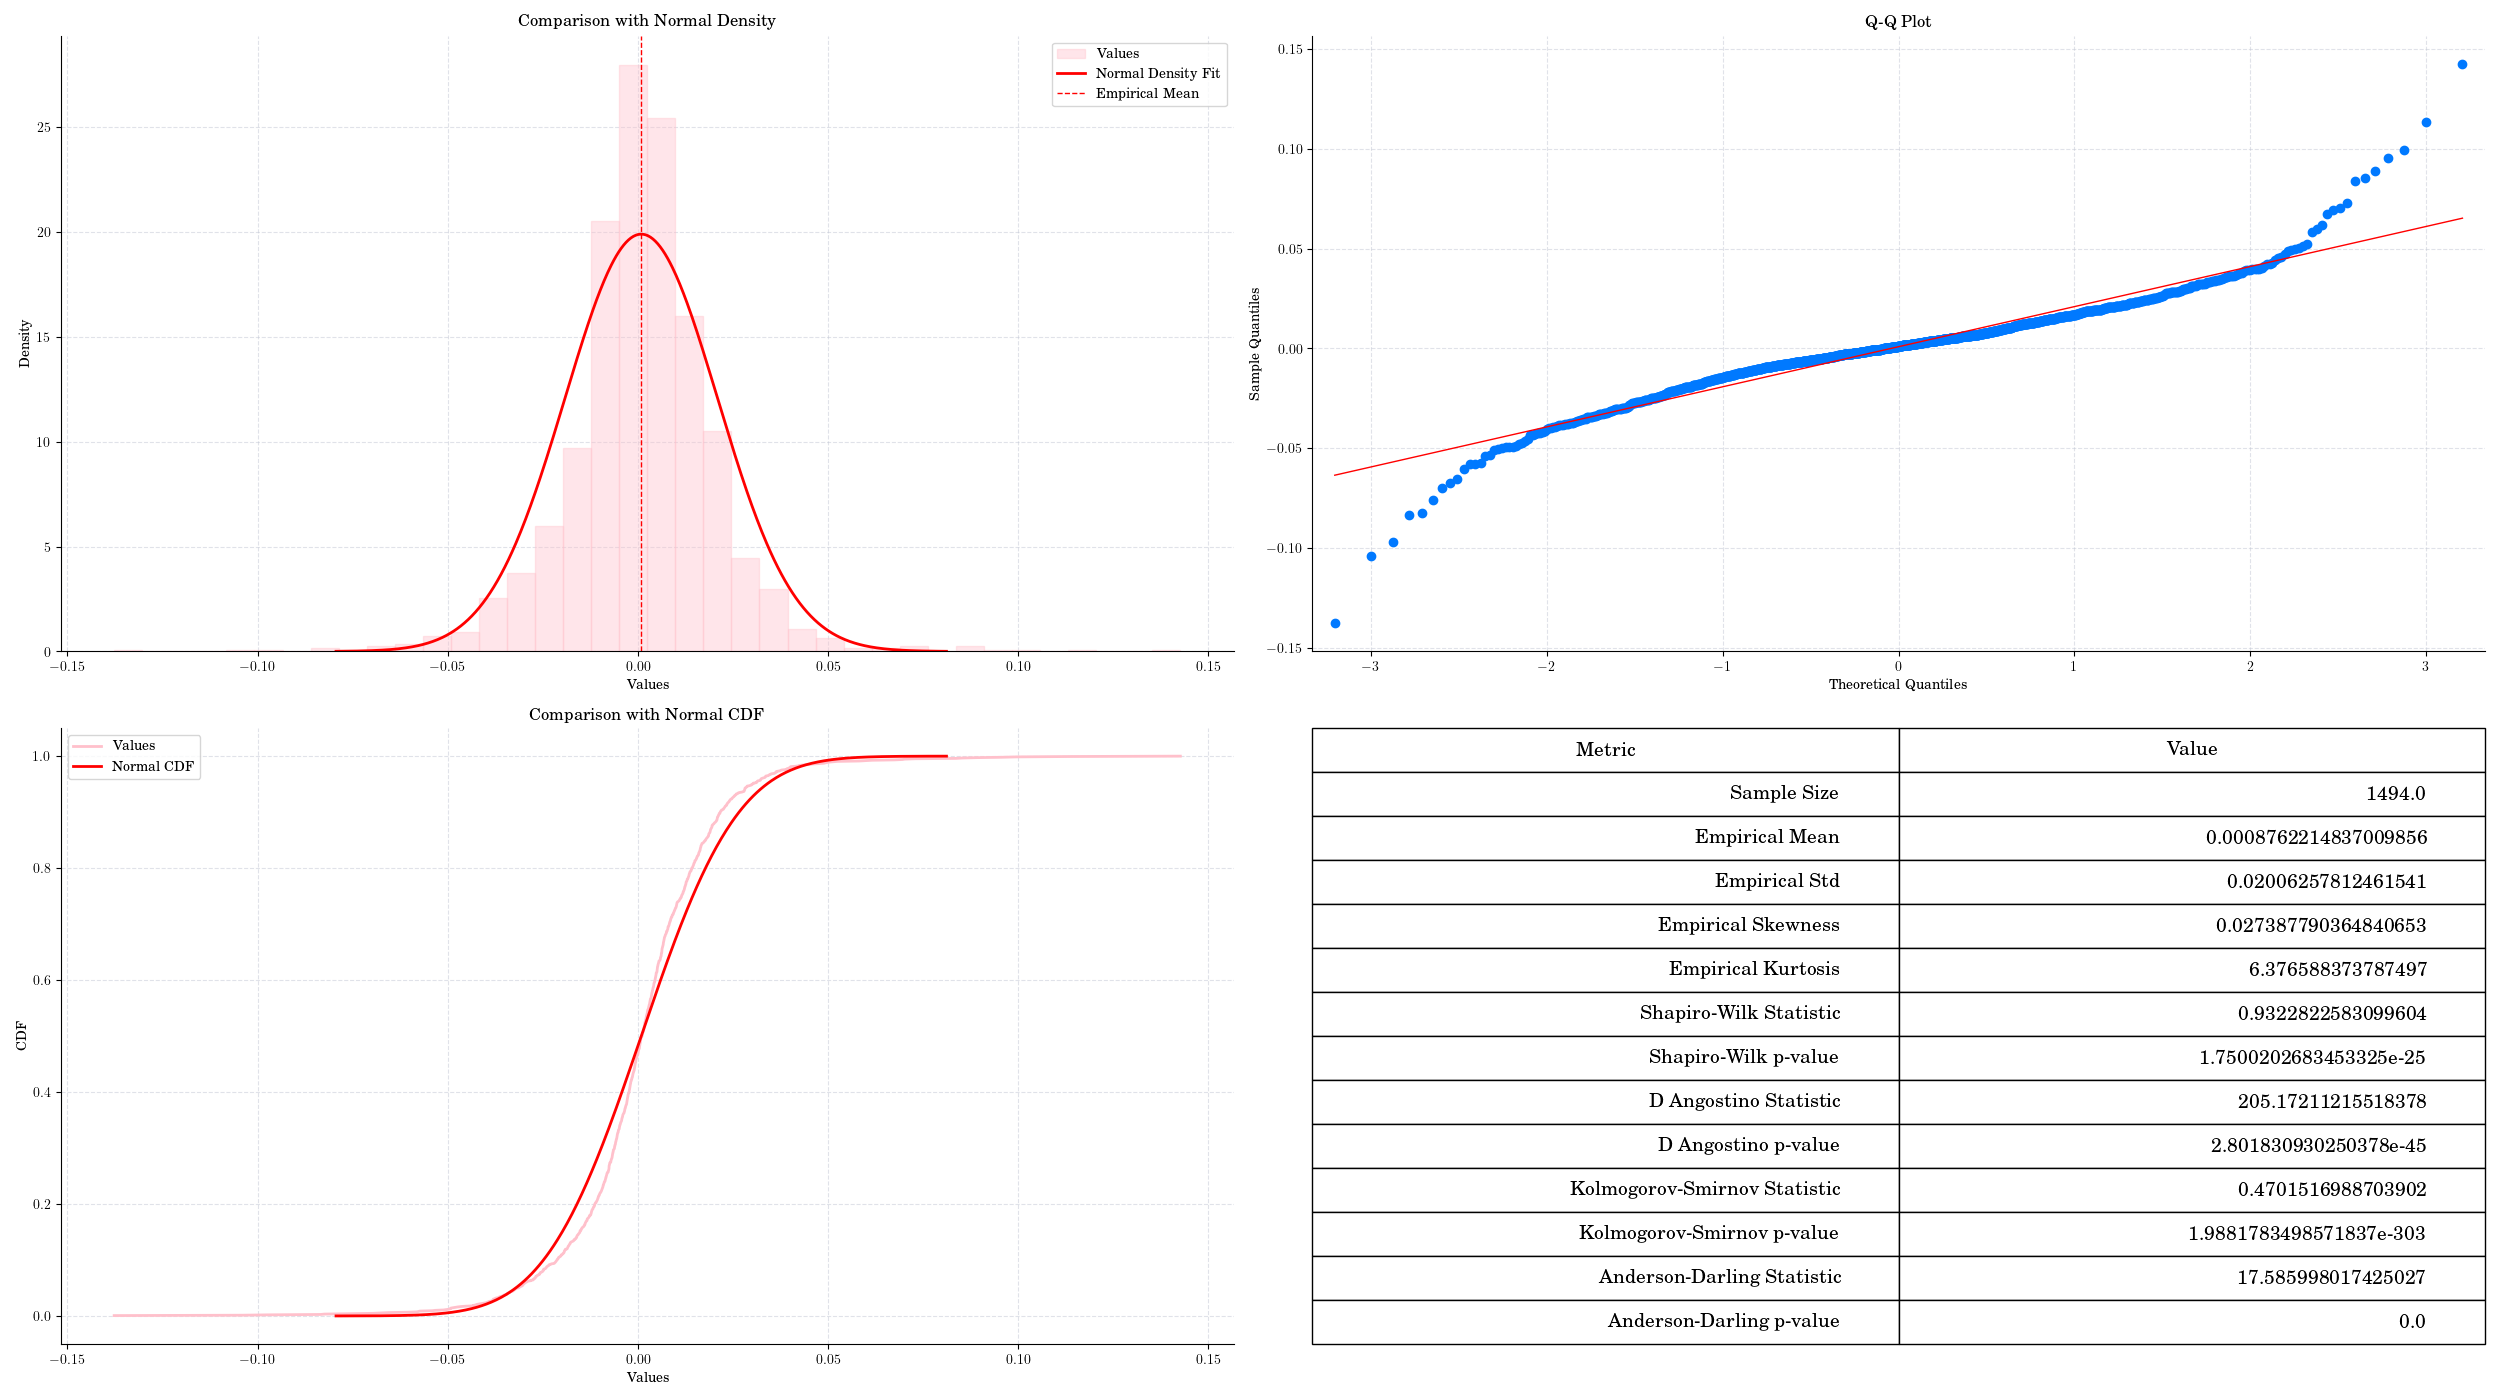
Normality Testing on real stock Logarithmic Returns.#
Random Facts#
The Shapiro-Wilk test was published in 1965 by statisticians Samuel Shapiro and Martin Wilk and remains one of the most widely used normality tests due to its effectiveness with small sample sizes.
The Kolmogorov-Smirnov test can be adapted to test against distributions other than the normal distribution, making it a versatile tool in statistical analysis.
The Anderson-Darling test is part of a family of tests that includes the Cramér-von Mises test, which also assesses the goodness-of-fit of a distribution.
Normality tests are sensitive to sample size; larger samples may detect minor deviations from normality that are not practically significant.