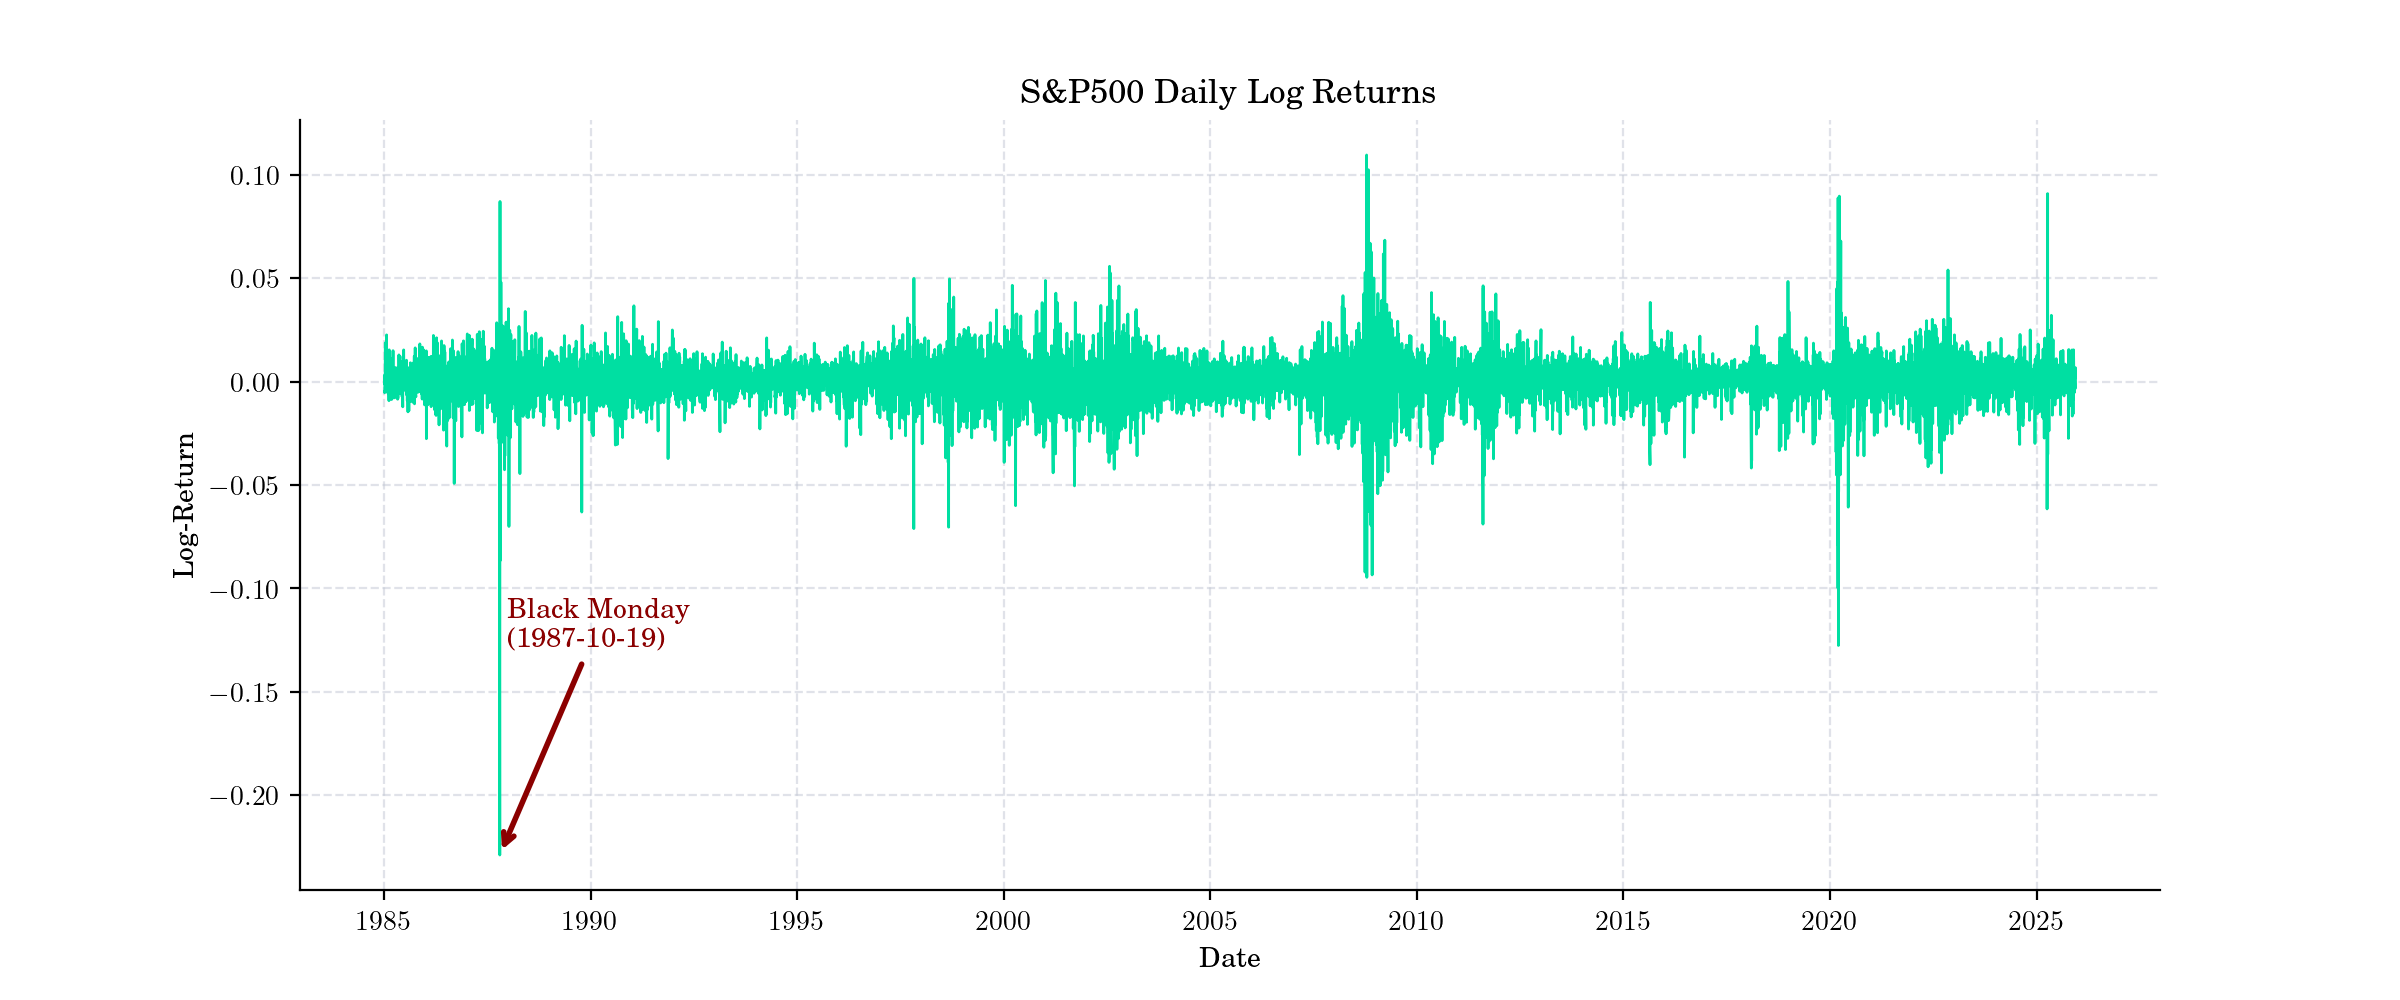
Day 6 : Black Monday#
“Will you open tomorrow? he asked. That was the scariest moment because the truthful answer I gave was ‘I do not know.’ What the Fed Chair was really asking was: ‘Will the longs pay the shorts?’”
—Leo Melamed (1997), former CEO, Chicago Mercantile Exchange (CME)
Following our discussion on returns from Day 5, we now explore one of the most dramatic market events that demonstrated the volatility of financial returns.
Black Monday (also known as Black Tuesday in some parts of the world due to time zone differences) was a global, severe and largely unexpected stock market crash on Monday, October 19, 1987. Worldwide losses were estimated at US$ 1.71 trillion. The severity sparked fears of extended economic instability or a reprise of the Great Depression.
On that day, the Dow Jones Industrial Average (DJIA) dropped by 508 points, a decline of 22.6%, which remains the largest one-day percentage loss in the DJIA’s history. The S&P 500 index also experienced a significant drop of 20.47%
On October 19, 1987, the Dow Jones Industrial Average (DJIA) fell 508.32 points, a decline of 22.61 percent, ending a bull market that had lasted since August 1982. A record volume of 604.33 million shares traded hands that day, three times the daily average. The New York Stock Exchange (NYSE) lost more than US$ 500 billion in market capitalization, its largest loss since the beginning of World War I in 1914. This collapse greatly surpassed its 12.8 percent single-day drop on [Black Thursday](https://www.goldmansachs.com/our-firm/history/moments/1929-financial-crash) of October 28, 1929.
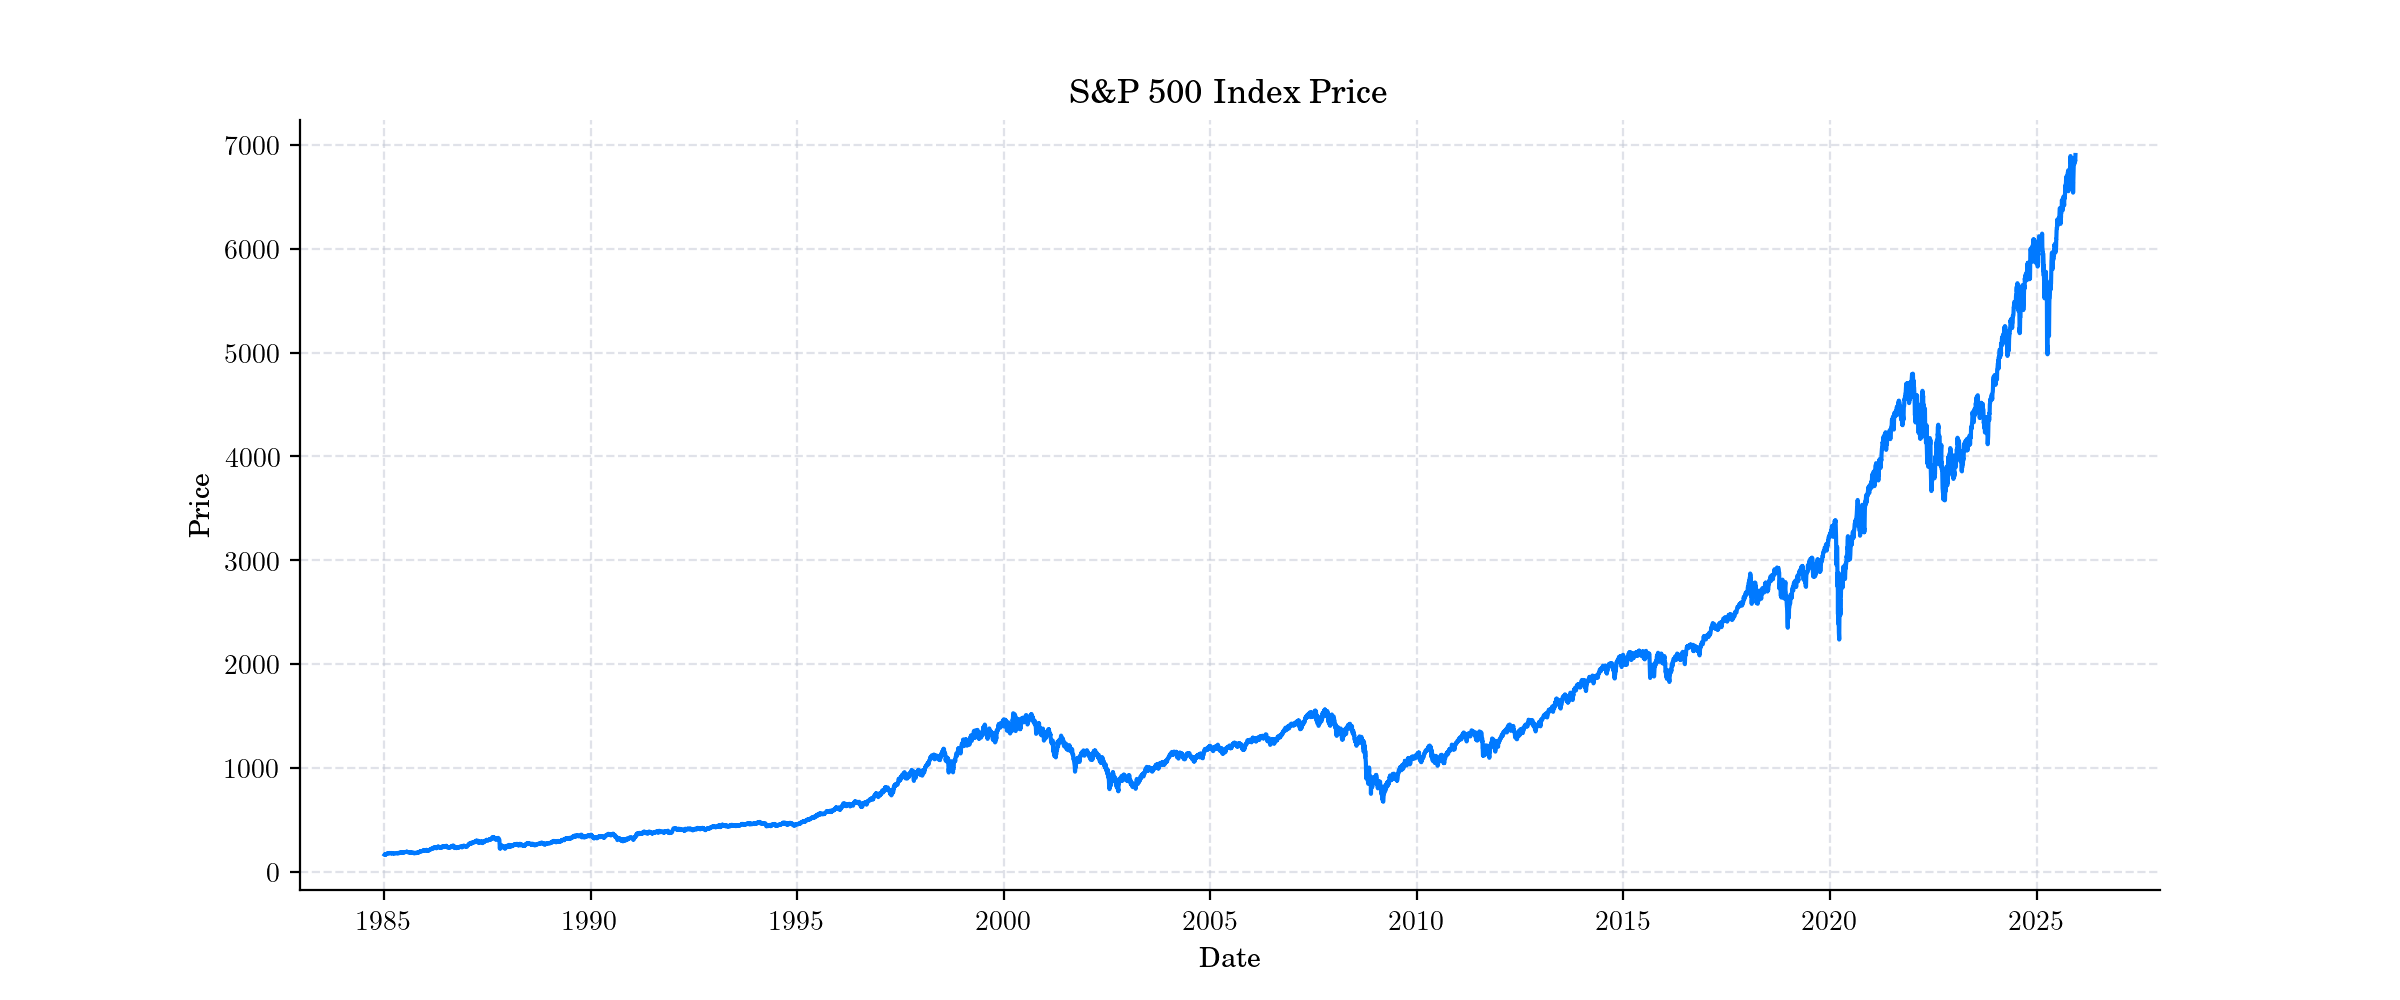
Let’s take a look at the S&P 500 index prices and log-returns to visualise the magnitud of the Black Monday events.