Note
Go to the end to download the full example code.
Moving Averages#
# Author: Dialid Santiago <d.santiago@outlook.com>
# License: MIT
# Description: Advent Calendar 2025 - Plot Moving Averages
import yfinance as yf
import pandas as pd
import matplotlib.pyplot as plt
import numpy as np
plt.style.use("https://raw.githubusercontent.com/quantgirluk/matplotlib-stylesheets/main/quant-pastel-light.mplstyle")
def download_data(ticker, start_date, end_date=None):
data = yf.download(ticker, start=start_date, end=end_date, progress=False, auto_adjust=False)
return data
def moving_average(prices, window):
return prices.rolling(window=window).mean()
def exponential_moving_average(prices, span):
return prices.ewm(span=span, adjust=False).mean()
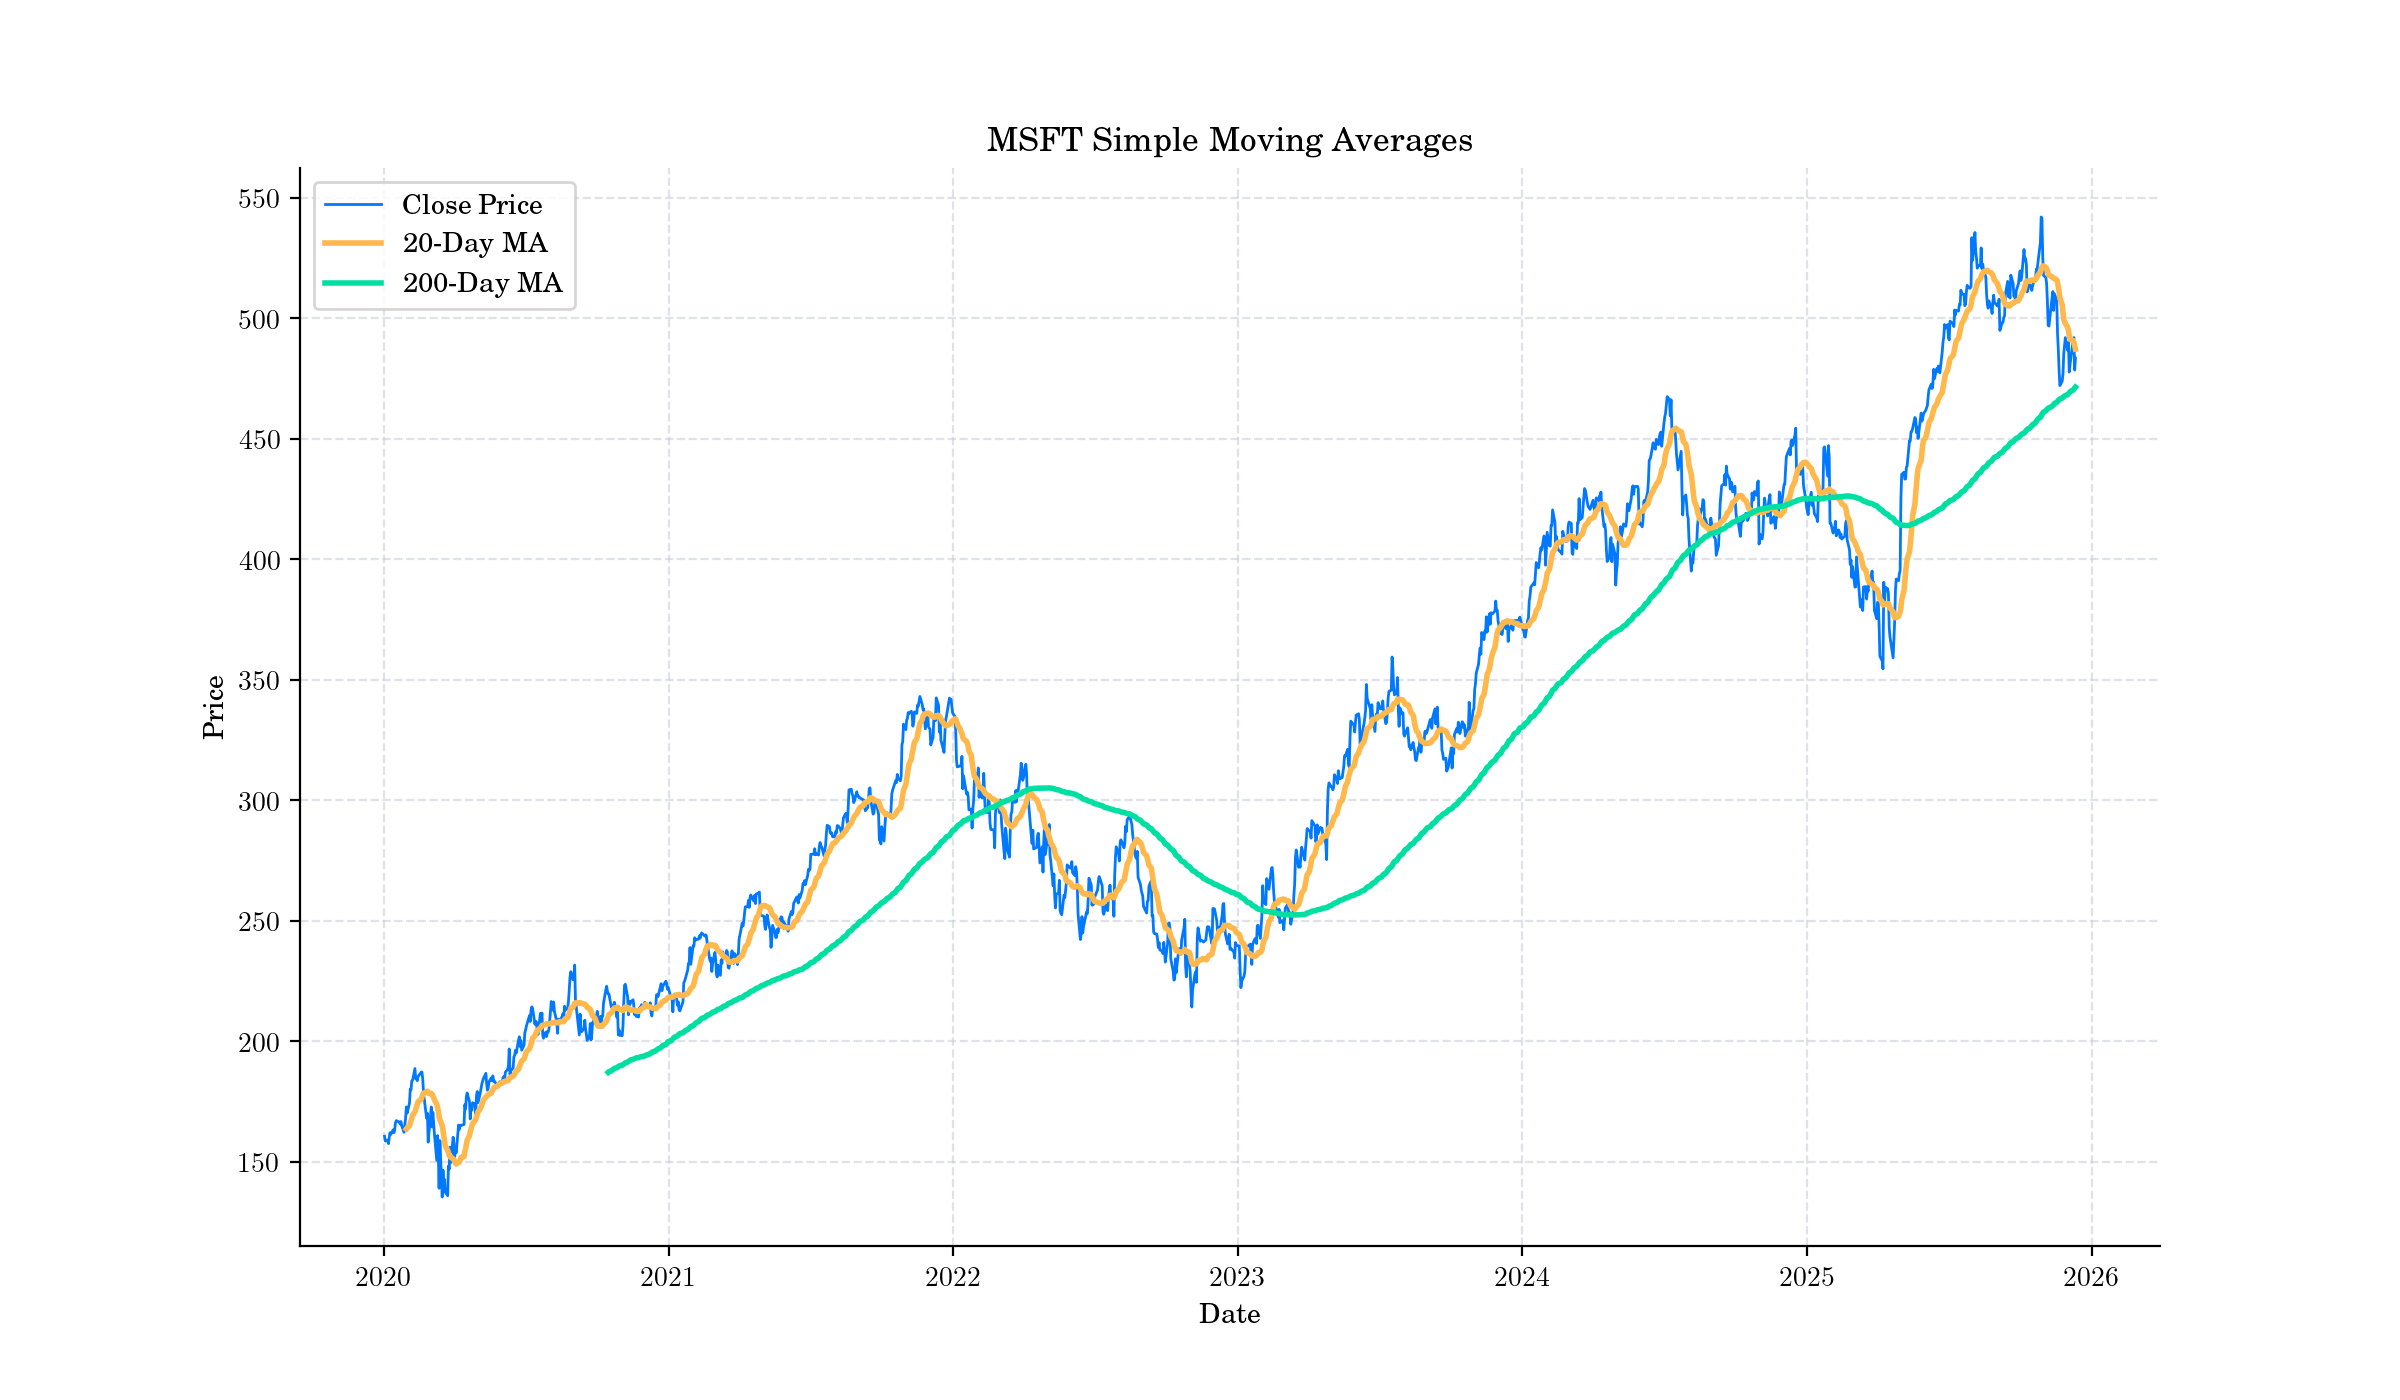
ticker = "MSFT"
data = yf.download(ticker, start="2020-01-01", progress=False, auto_adjust=False)
moving_avg_short = moving_average(data['Close'], window=20)
moving_avg_long = moving_average(data['Close'], window=200)
fig, ax = plt.subplots(dpi=200, figsize=(12,7))
ax.plot(data.index, data['Close'], label='Close Price', linewidth=1)
ax.plot(data.index, moving_avg_short, label='20-Day MA', linewidth=2)
ax.plot(data.index, moving_avg_long, label='200-Day MA', linewidth=2)
plt.title(f'{ticker} Simple Moving Averages')
plt.xlabel('Date')
plt.ylabel('Price')
plt.legend()
plt.show()
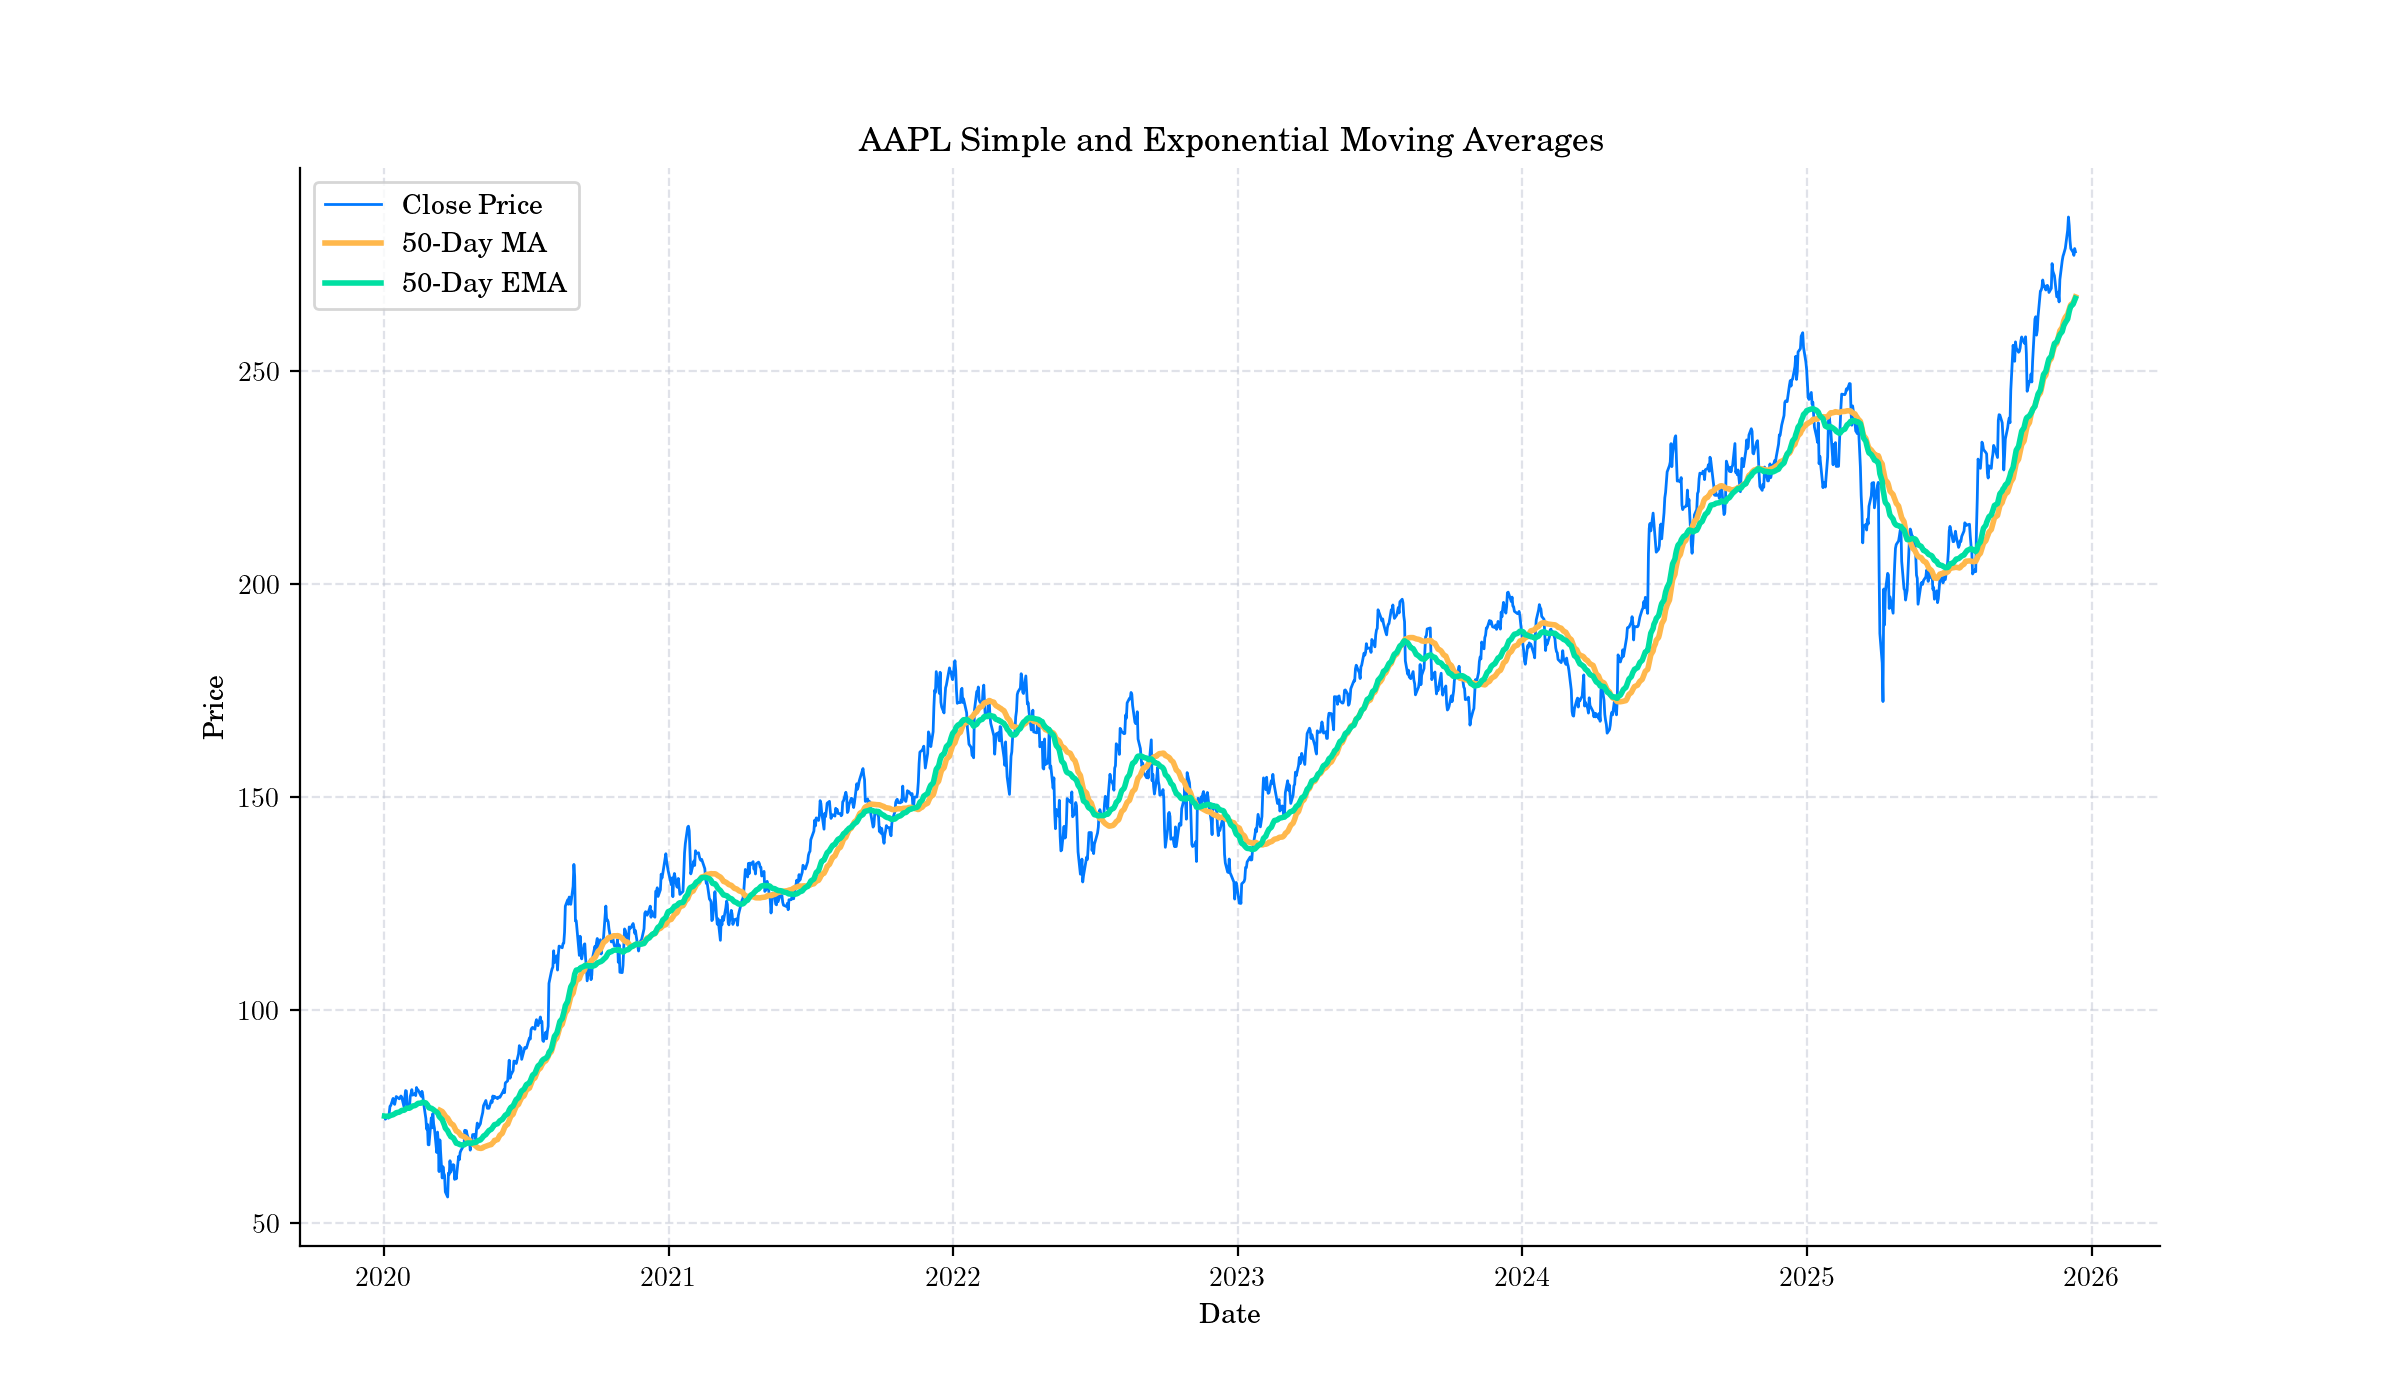
ticker = "AAPL"
data = yf.download(ticker, start="2020-01-01", progress=False, auto_adjust=False)
moving_avg = moving_average(data['Close'], window=50)
exp_moving_avg = exponential_moving_average(data['Close'], span=50)
fig, ax = plt.subplots(dpi=200, figsize=(12,7))
ax.plot(data.index, data['Close'], label='Close Price', linewidth=1)
ax.plot(data.index, moving_avg, label='50-Day MA', linewidth=2)
ax.plot(data.index, exp_moving_avg, label='50-Day EMA', linewidth=2)
plt.title(f'{ticker} Simple and Exponential Moving Averages')
plt.xlabel('Date')
plt.ylabel('Price')
plt.legend()
plt.grid(True)
plt.show()
Total running time of the script: (0 minutes 3.459 seconds)