Note
Go to the end to download the full example code.
Returns and Log-Returns#
# Author: Dialid Santiago <d.santiago@outlook.com>
# License: MIT
# Description: Advent Calendar 2025 Day 5 - Plotting Returns of S&P 500
import yfinance as yf
import pandas as pd
import numpy as np
import matplotlib.pyplot as plt
quant_pastel = "https://raw.githubusercontent.com/quantgirluk/matplotlib-stylesheets/main/quant-pastel-light.mplstyle"
plt.style.use(quant_pastel)
plt.rc('font', family='sans-serif')
plt.rc('font', serif='Apple SD Gothic Neo')
plt.rcParams.update({'font.size': 12})
# ---------------------------------------------------------
# 1. Download S&P 500 Daily Prices from Yahoo Finance
# ---------------------------------------------------------
ticker = "^GSPC"
data = yf.download(ticker, start="2000-01-01", progress=False, auto_adjust=False)
prices = data["Close"]
# ---------------------------------------------------------
# 2. Compute Returns
# ---------------------------------------------------------
returns = prices.pct_change()
log_returns = np.log(prices / prices.shift(1))
# ---------------------------------------------------------
# 3. Multi-panel Figure
# ---------------------------------------------------------
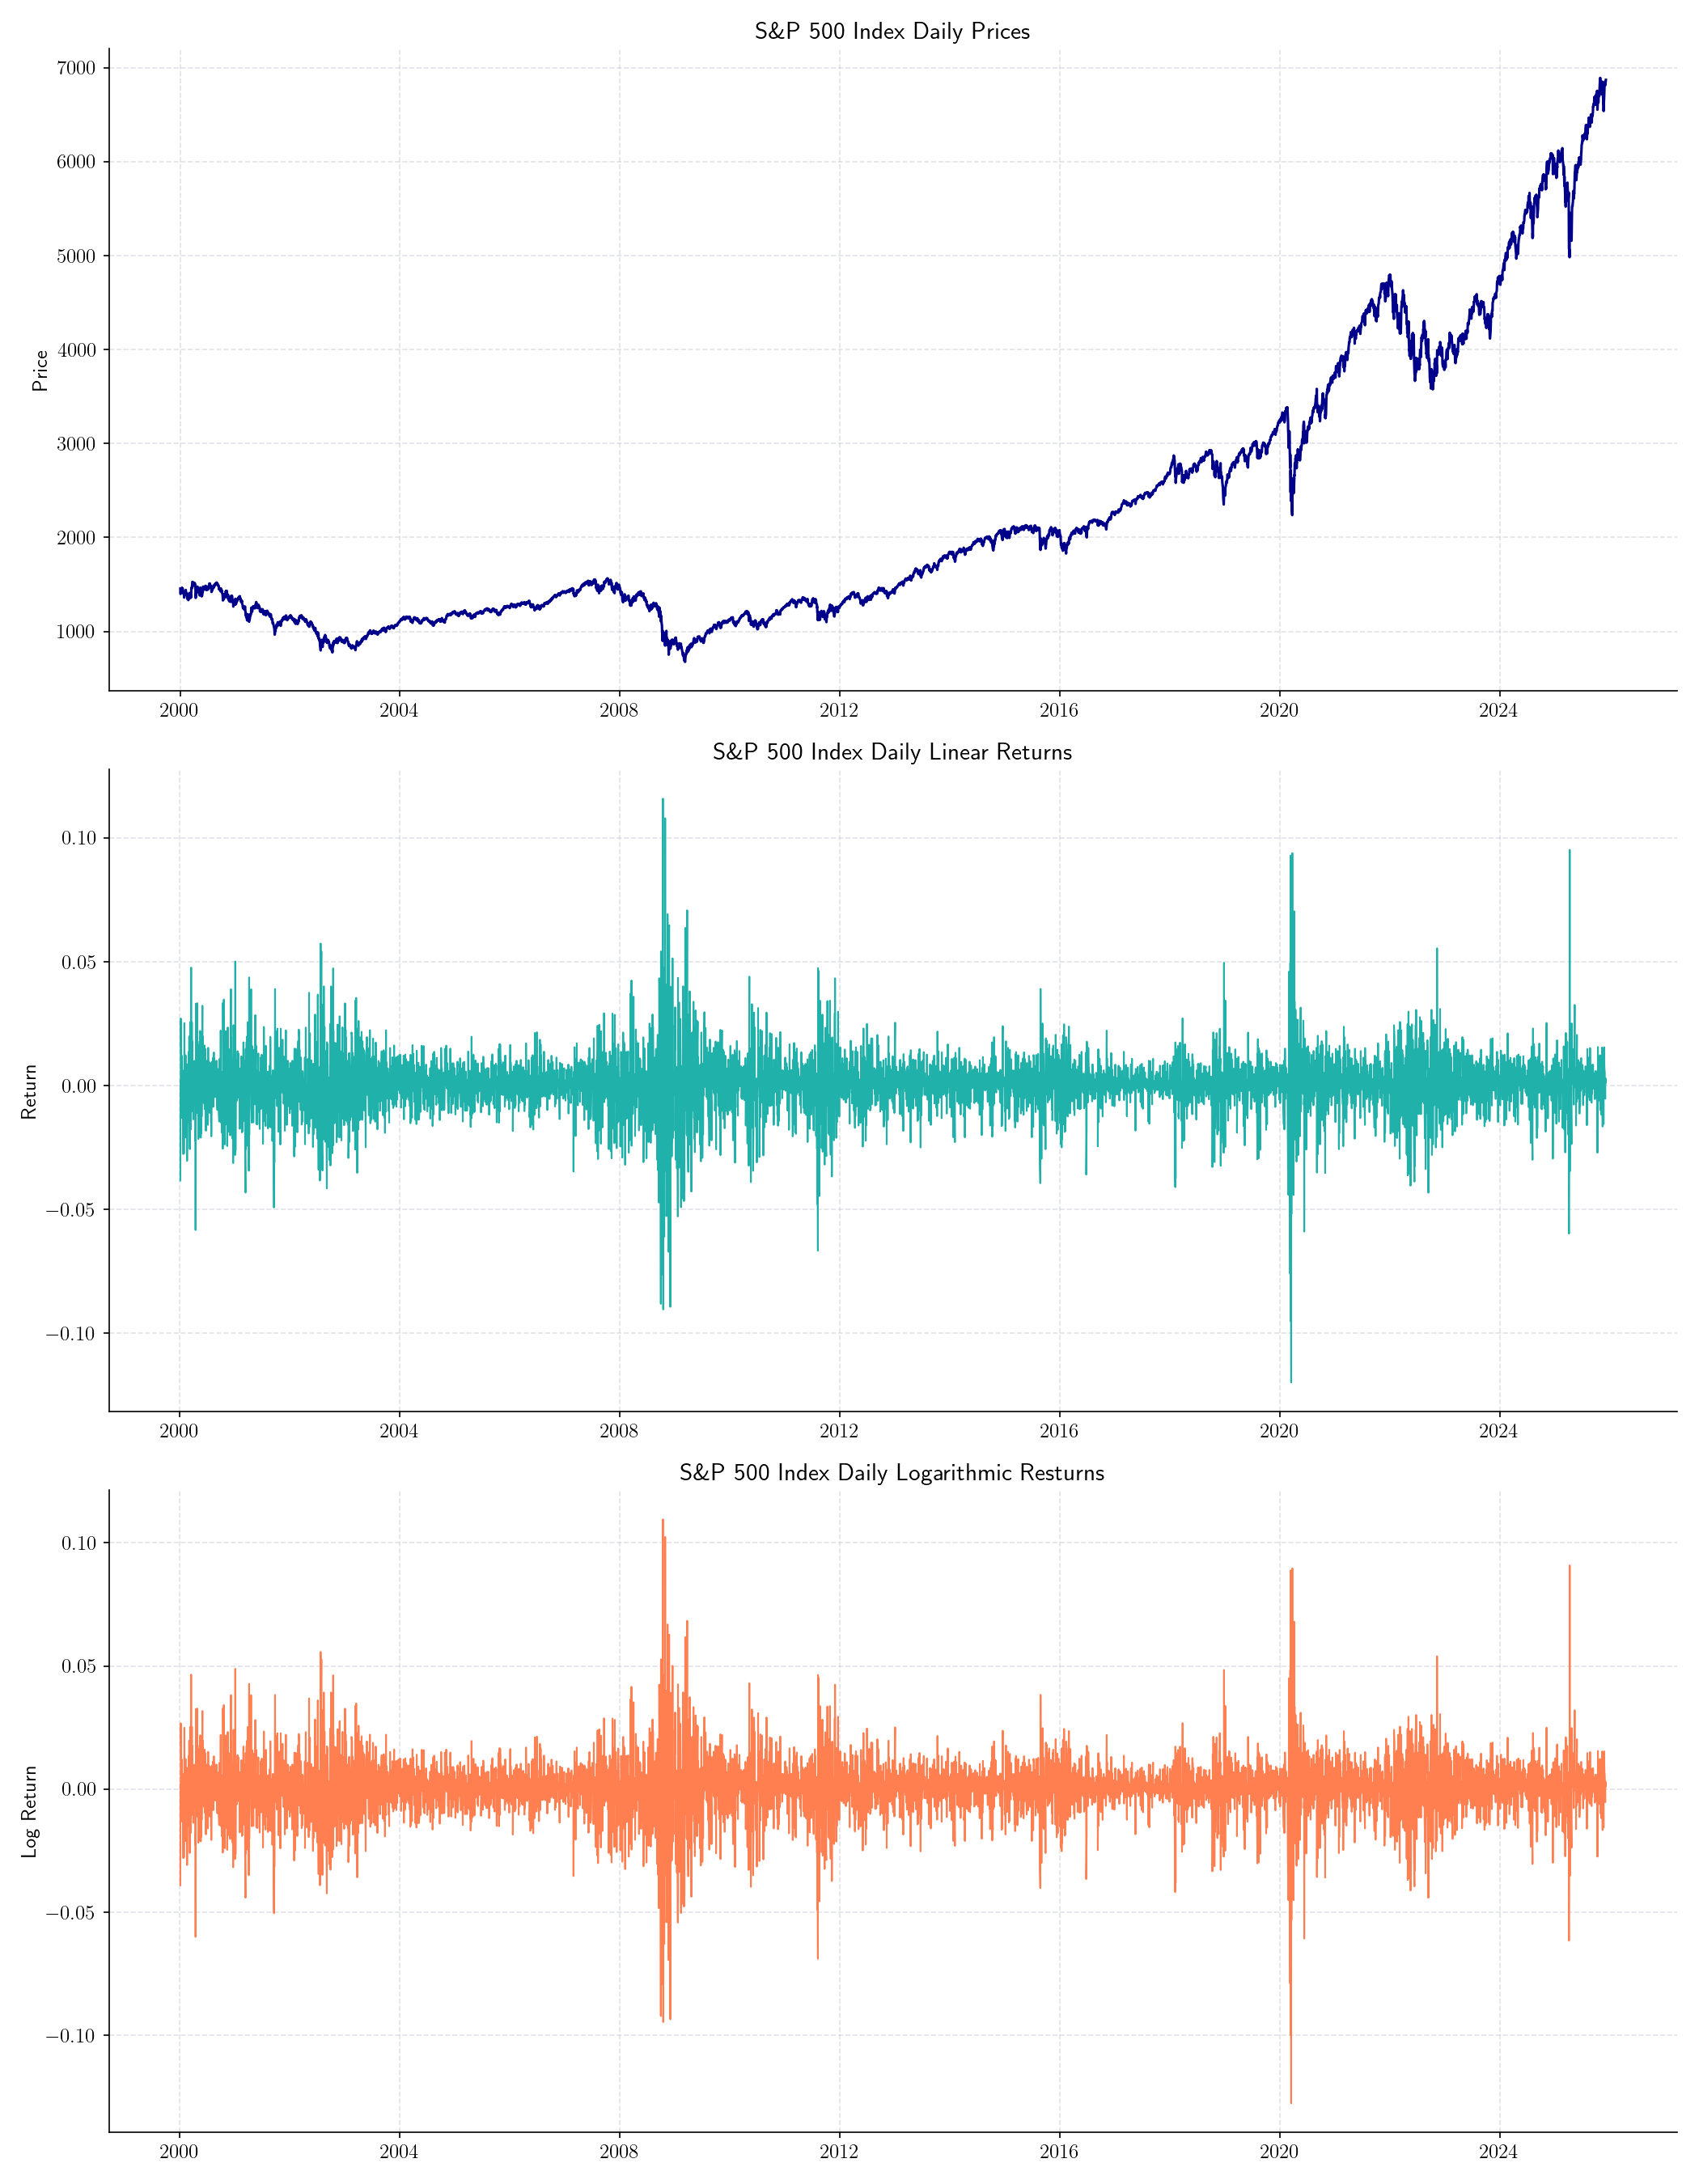
fig, axes = plt.subplots(3, 1, figsize=(14, 18), sharex=False, dpi=150)
# Price
axes[0].plot(prices, color='darkblue', linewidth=1.5)
axes[0].set_title("S\\&P 500 Index Daily Prices")
axes[0].set_ylabel("Price")
axes[0].grid(True)
# Returns
axes[1].plot(returns, color='lightseagreen')
axes[1].set_title("S\\&P 500 Index Daily Linear Returns")
axes[1].set_ylabel("Return")
axes[1].grid(True)
# Log Returns
axes[2].plot(log_returns, color='coral')
axes[2].set_title("S\\&P 500 Index Daily Logarithmic Resturns")
axes[2].set_ylabel("Log Return")
axes[2].grid(True)
plt.tight_layout()
plt.show()
# Histogram and box plot of returns
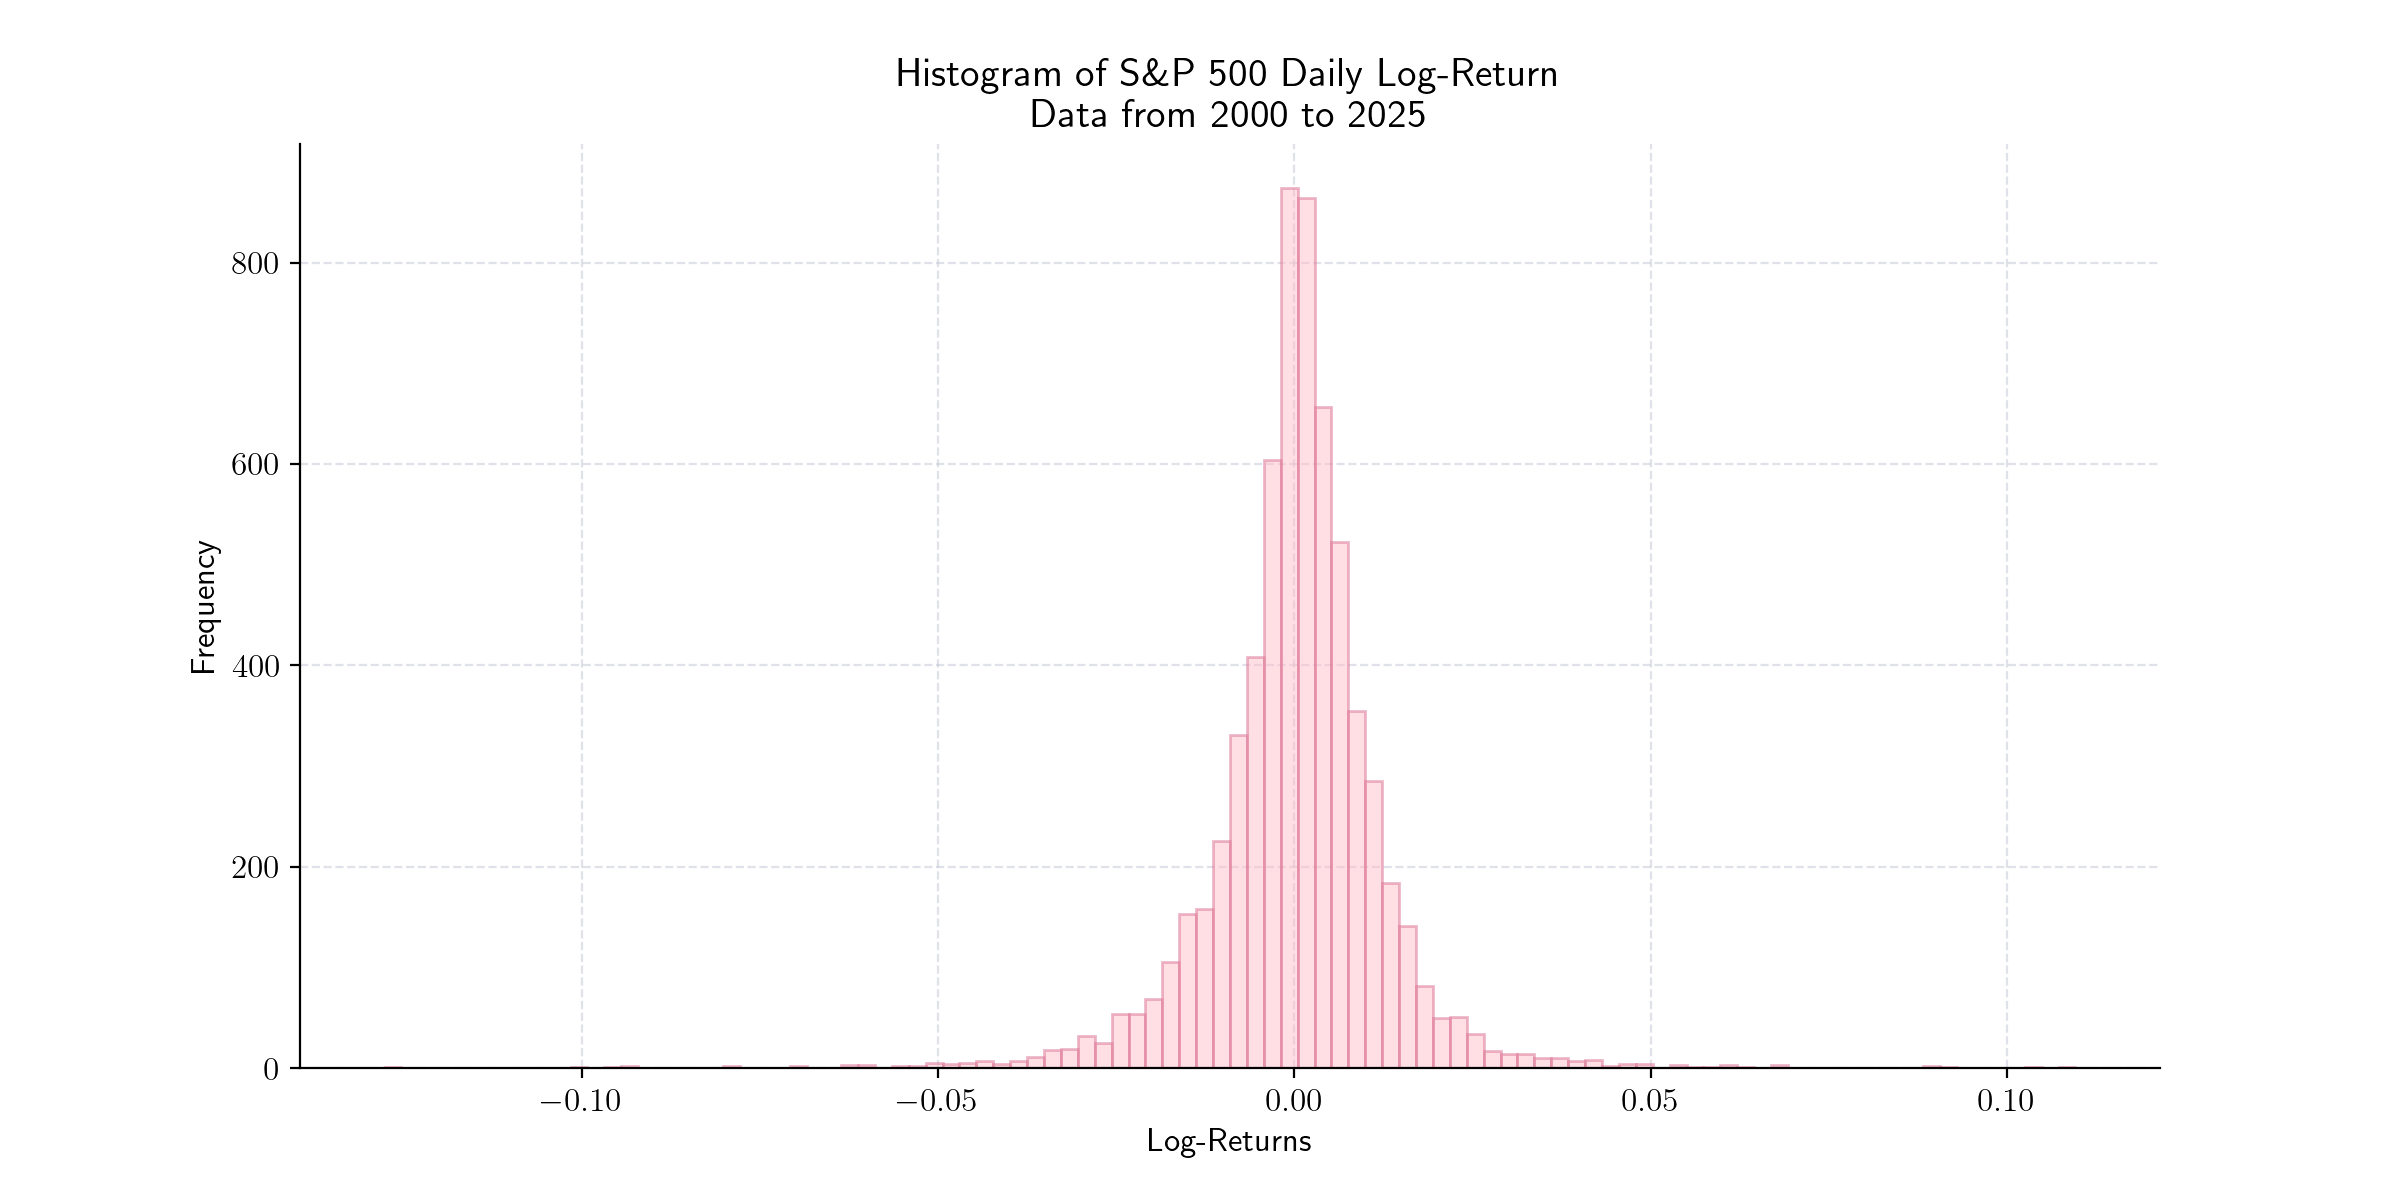
plt.figure(figsize=(12, 6), dpi=200)
plt.hist(log_returns.dropna(), bins=100, alpha=0.5, color='pink', edgecolor='palevioletred')
plt.title("Histogram of S\\&P 500 Daily Log-Return\n Data from 2000 to 2025",)
plt.xlabel("Log-Returns")
plt.ylabel("Frequency")
plt.show()
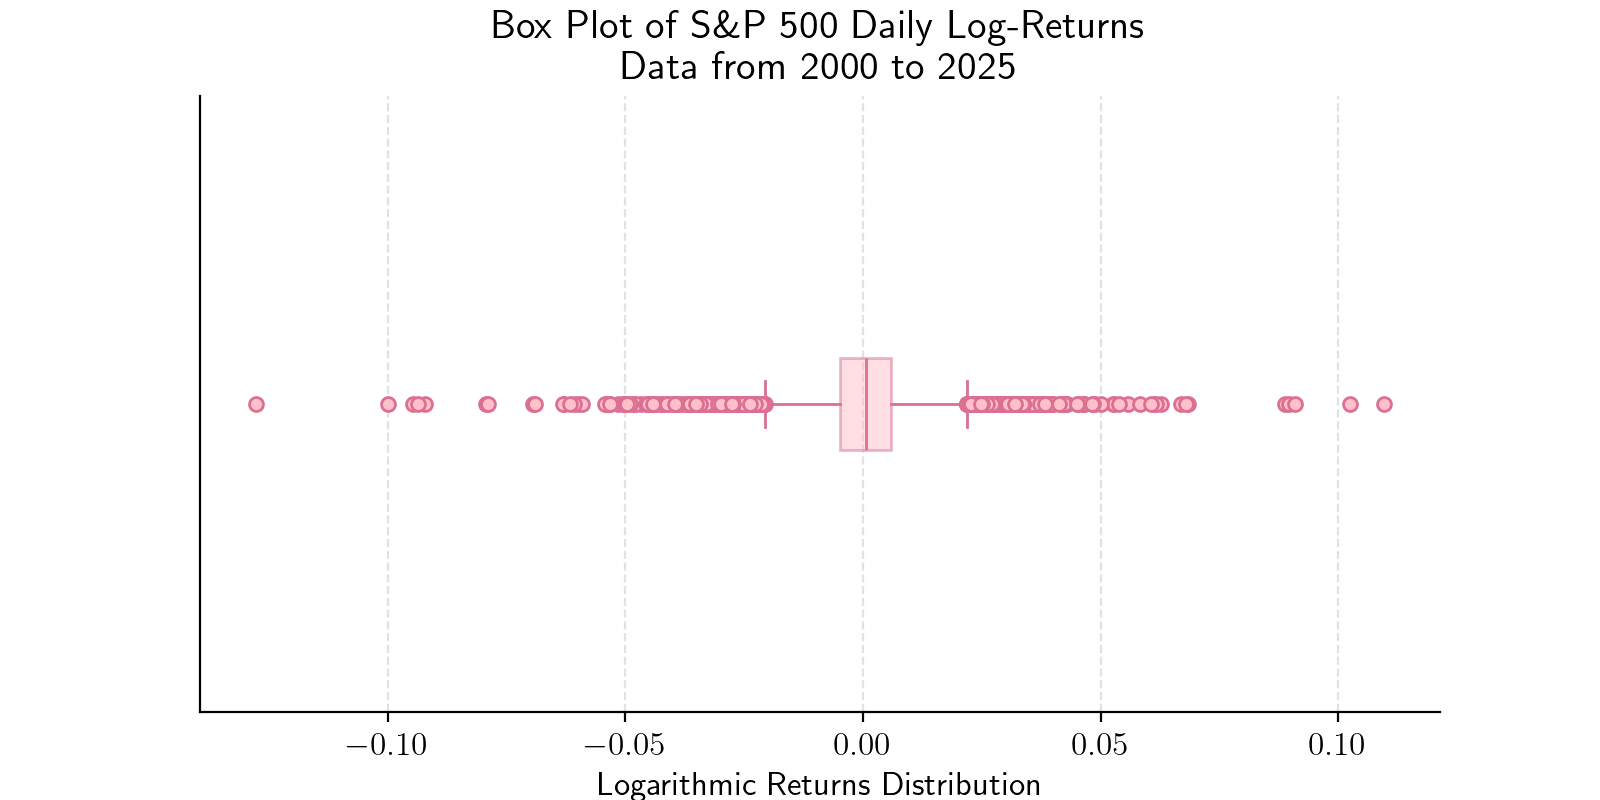
plt.figure(figsize=(8, 4), dpi=200)
plt.boxplot(
log_returns.dropna(),
orientation='horizontal',
patch_artist=True,
boxprops=dict(edgecolor='palevioletred', facecolor='pink', alpha=0.5),
medianprops=dict(color='palevioletred'),
whiskerprops=dict(color='palevioletred'),
capprops=dict(color='palevioletred'),
flierprops=dict(marker='o', markerfacecolor='pink', markeredgecolor='palevioletred', markersize=5)
)
plt.yticks([])
plt.title("Box Plot of S\\&P 500 Daily Log-Returns\n Data from 2000 to 2025")
plt.xlabel("Logarithmic Returns Distribution")
plt.grid(True)
plt.show()
Total running time of the script: (0 minutes 6.276 seconds)