Note
Go to the end to download the full example code.
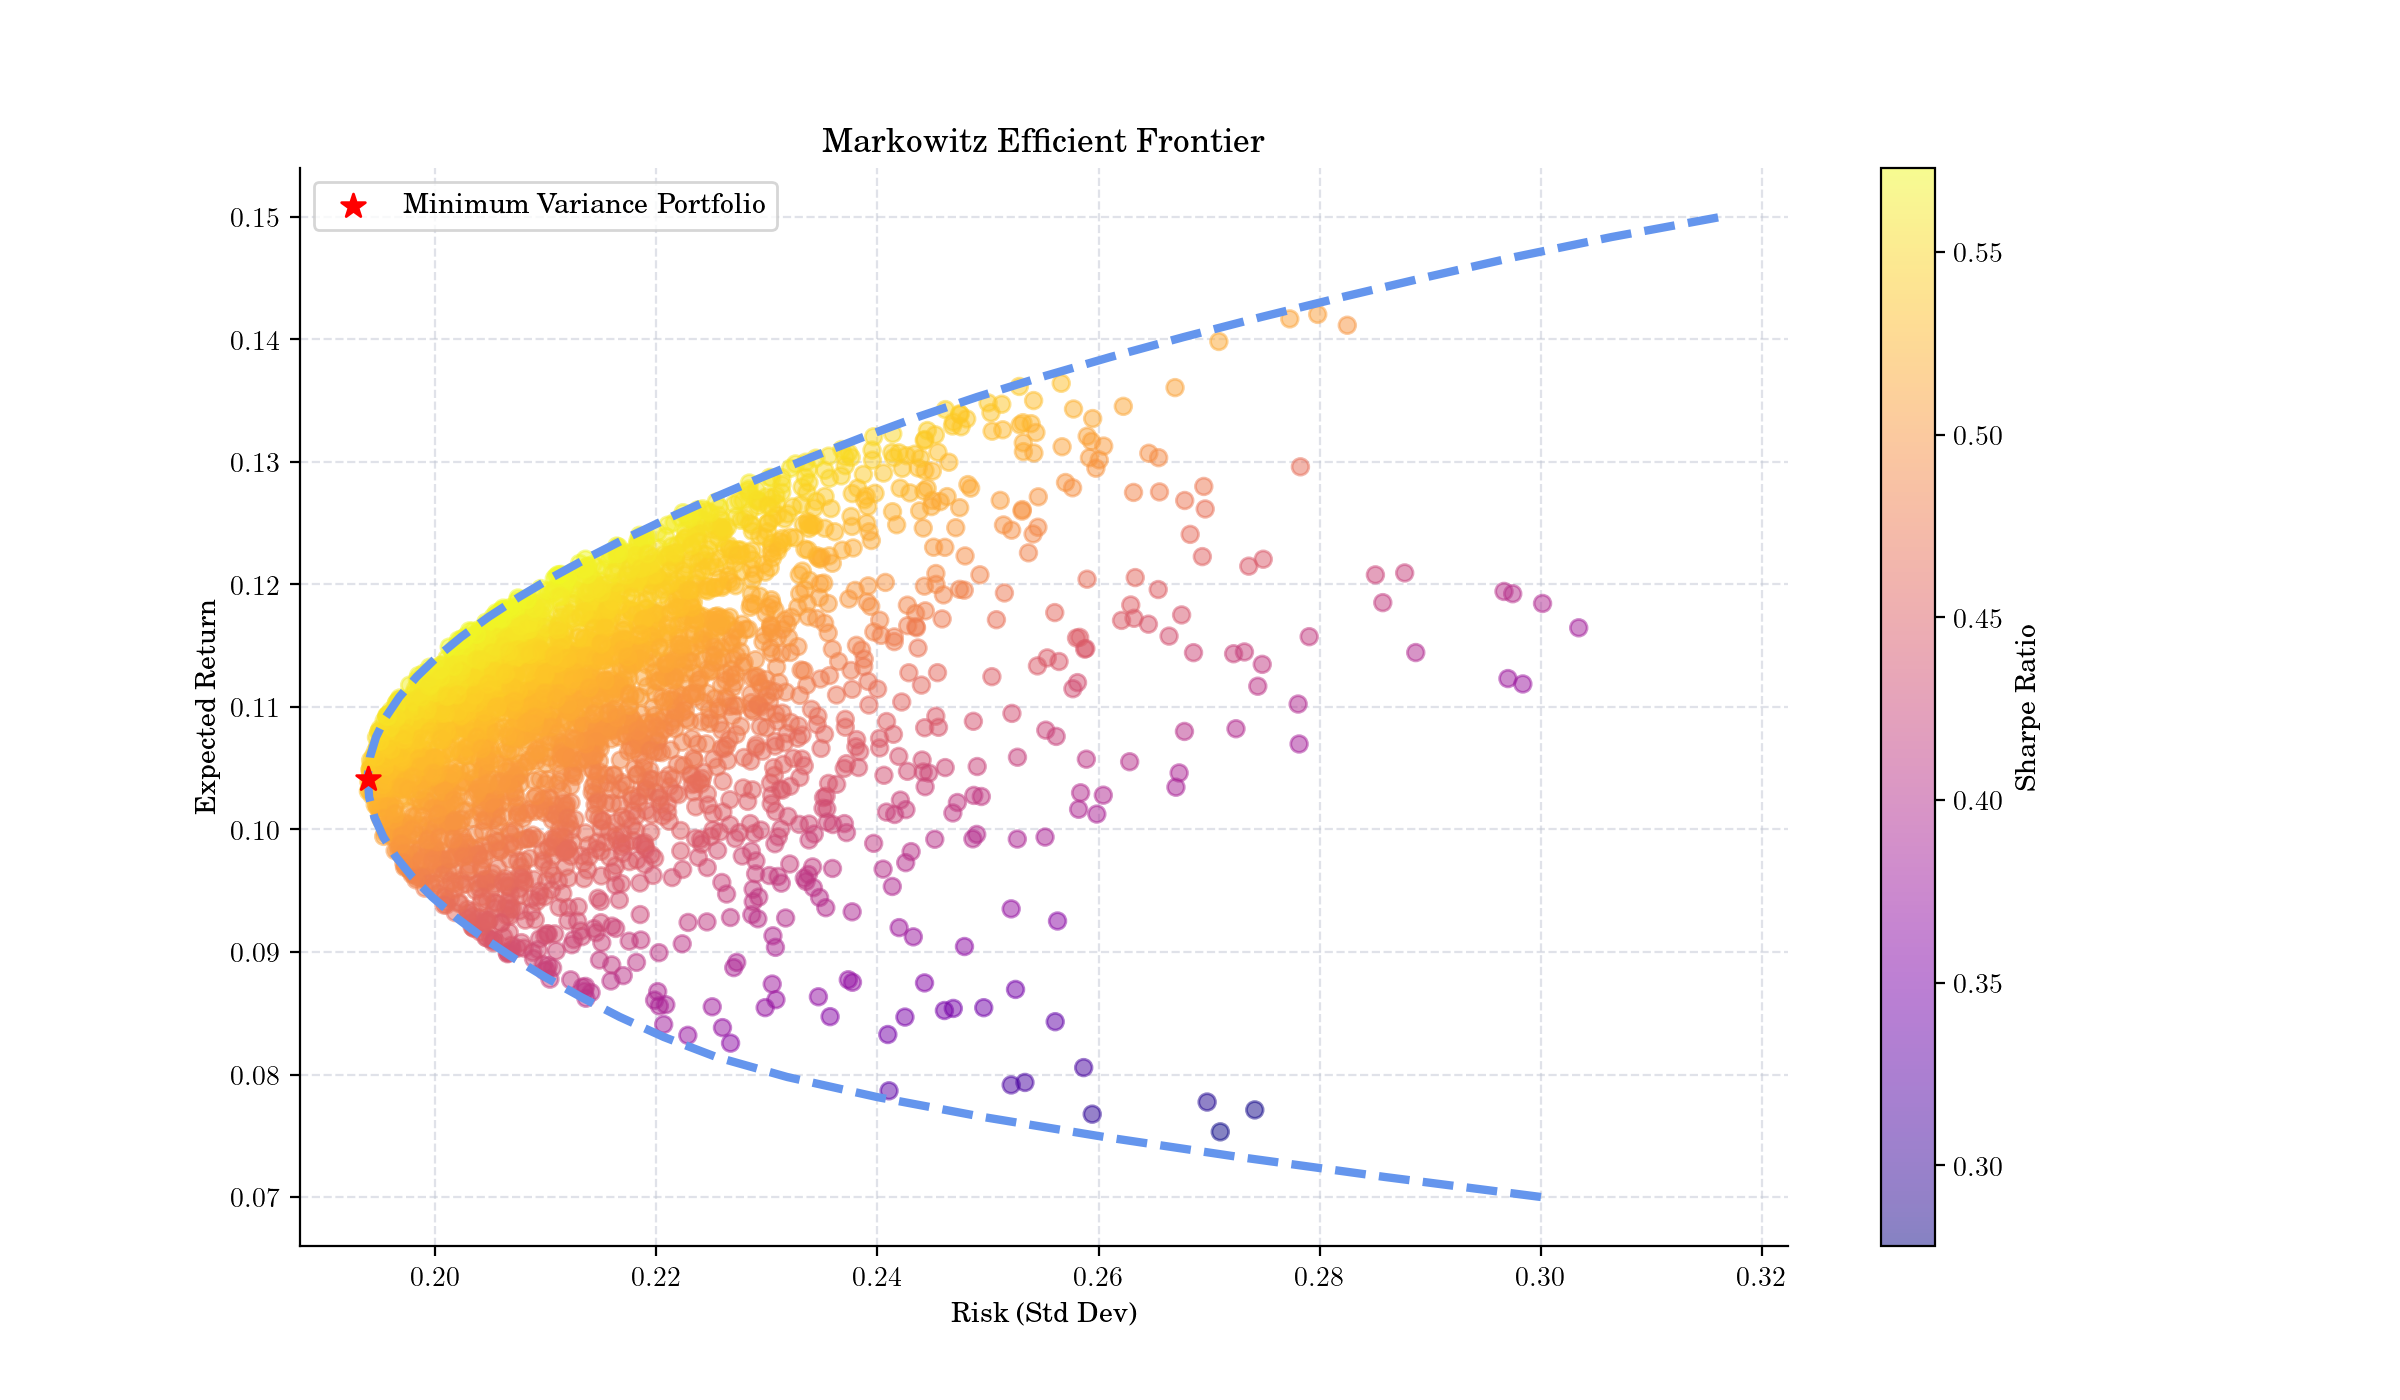
Markowitz Efficient Frontier#
# Author: Dialid Santiago <d.santiago@outlook.com>
# License: MIT
# Description: Advent Calendar 2025 - Plot Markowitz Efficient Frontier

import numpy as np
import matplotlib.pyplot as plt
from scipy.optimize import minimize

plt.style.use(
    "https://raw.githubusercontent.com/quantgirluk/matplotlib-stylesheets/main/quant-pastel-light.mplstyle")


# Asset inputs
mu = np.array([0.15, 0.10, 0.12, 0.07]) # expected returns
n_assets = len(mu)
Sigma = np.array([
[0.10, 0.02, 0.04, 0.01],
[0.02, 0.08, 0.02, 0.01],
[0.04, 0.02, 0.12, 0.03],
[0.01, 0.01, 0.03, 0.09]
])
n = len(mu)

n_portfolios = 3000
returns = np.zeros(n_portfolios)
risks = np.zeros(n_portfolios)

for i in range(n_portfolios):
    w = np.random.rand(n_assets)
    w /= w.sum()
    returns[i] = w @ mu
    risks[i] = np.sqrt(w @ Sigma @ w)

# Sharpe ratio (assuming zero risk-free rate)
sharpes = returns / risks

# Constraints
cons_sum = {'type': 'eq', 'fun': lambda w: np.sum(w) - 1}
bounds = [(0, 1)] * n

# Portfolio functions
def port_return(w):
    return w @ mu

def port_risk(w):
    return np.sqrt(w @ Sigma @ w)

# Minimum variance portfolio
res_mvp = minimize(port_risk, x0=np.ones(n)/n,
bounds=bounds, constraints=cons_sum)
w_mvp = res_mvp.x

# Efficient frontier
target_returns = np.linspace(mu.min(), mu.max(), 50)
frontier_risk = []

for r in target_returns:
    cons = (
    cons_sum,
    {'type': 'eq', 'fun': lambda w, r=r: w @ mu - r}
    )
    res = minimize(port_risk, x0=np.ones(n)/n,
    bounds=bounds, constraints=cons)
    frontier_risk.append(res.fun)

# Plot
fig, ax = plt.subplots(figsize=(12, 7), dpi=200)
plt.scatter(risks, returns, c=sharpes, cmap="plasma", alpha=0.5)
plt.colorbar(label="Sharpe Ratio")
plt.plot(frontier_risk, target_returns, linewidth=3, color='cornflowerblue', linestyle='--')
plt.scatter(port_risk(w_mvp), port_return(w_mvp), s=80, marker='*', color='red', zorder=5, label="Minimum Variance Portfolio")
plt.xlabel("Risk (Std Dev)")
plt.ylabel("Expected Return")
plt.title("Markowitz Efficient Frontier")
plt.legend()
plt.show()
Total running time of the script: (0 minutes 2.169 seconds)