Day 7 : Moving Averages#
“Nothing good happens below the 200 day moving average.”
—Paul Tudor Jones, Hedge Fund Manager
When markets feel chaotic, one of the simplest yet most surprisingly powerful tools we reach for is the moving average. Despite its simplicity, this concept serves as a backbone in technical analysis, signal smoothing, volatility control, algorithmic trading, and even modern machine-learning-based forecasting pipelines.
Definition. A moving average is a rolling measure of the central tendency of a time series. It takes recent observations, combines them in a particular way, and produces a smoothed value that filters out short-term noise so we can focus on the underlying trend. There are several types of moving averages, but the most common ones are:
1. Simple Moving Average (SMA)
Given a time series \(x_1, x_2, \dots, x_t\), the SMA over a window of length (n) is:
That is, each of the last n values gets equal weight.
2. Exponential Moving Average (EMA)
The EMA gives more weight to recent observations. Its recursive form:
where \(\alpha\) is a smoothing factor often defined as:
This makes the EMA react faster to new information—one of the reasons traders like it.
3. Weighted Moving Average (WMA)
Int this case, the weights are explicitly chosen (often linearly increasing):
For example, \((w_i = n-i )\) gives the most recent point the highest weight.
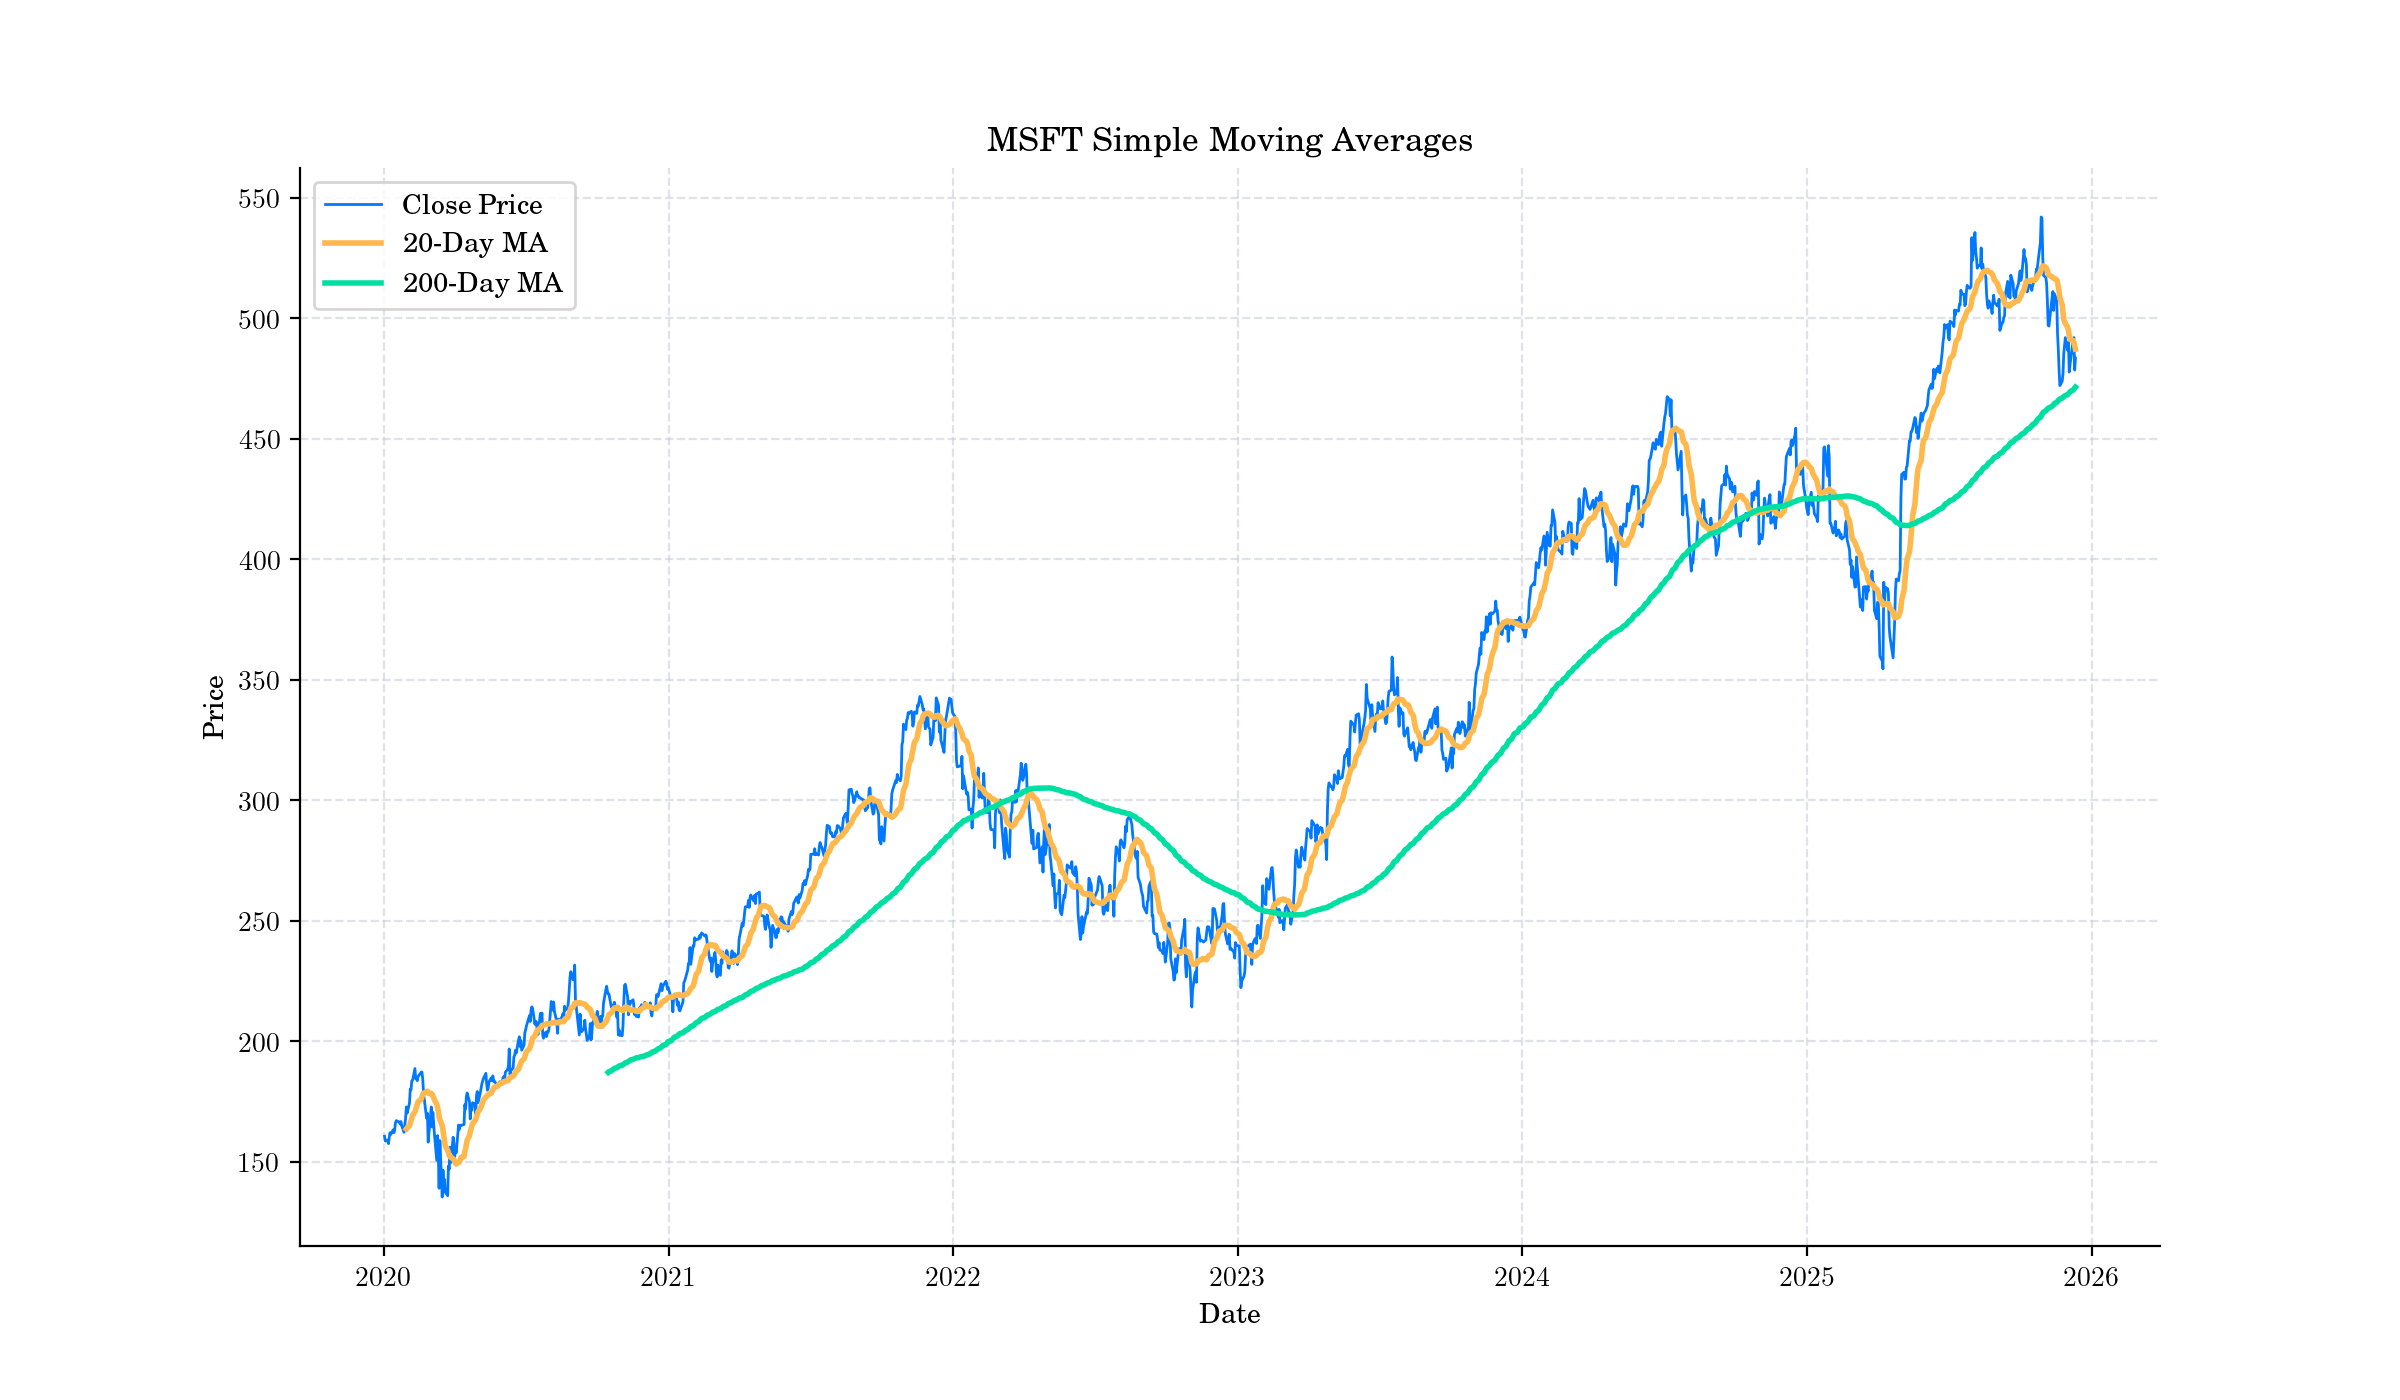
Moving Averages Prices. Source: Yahoo Finance.#
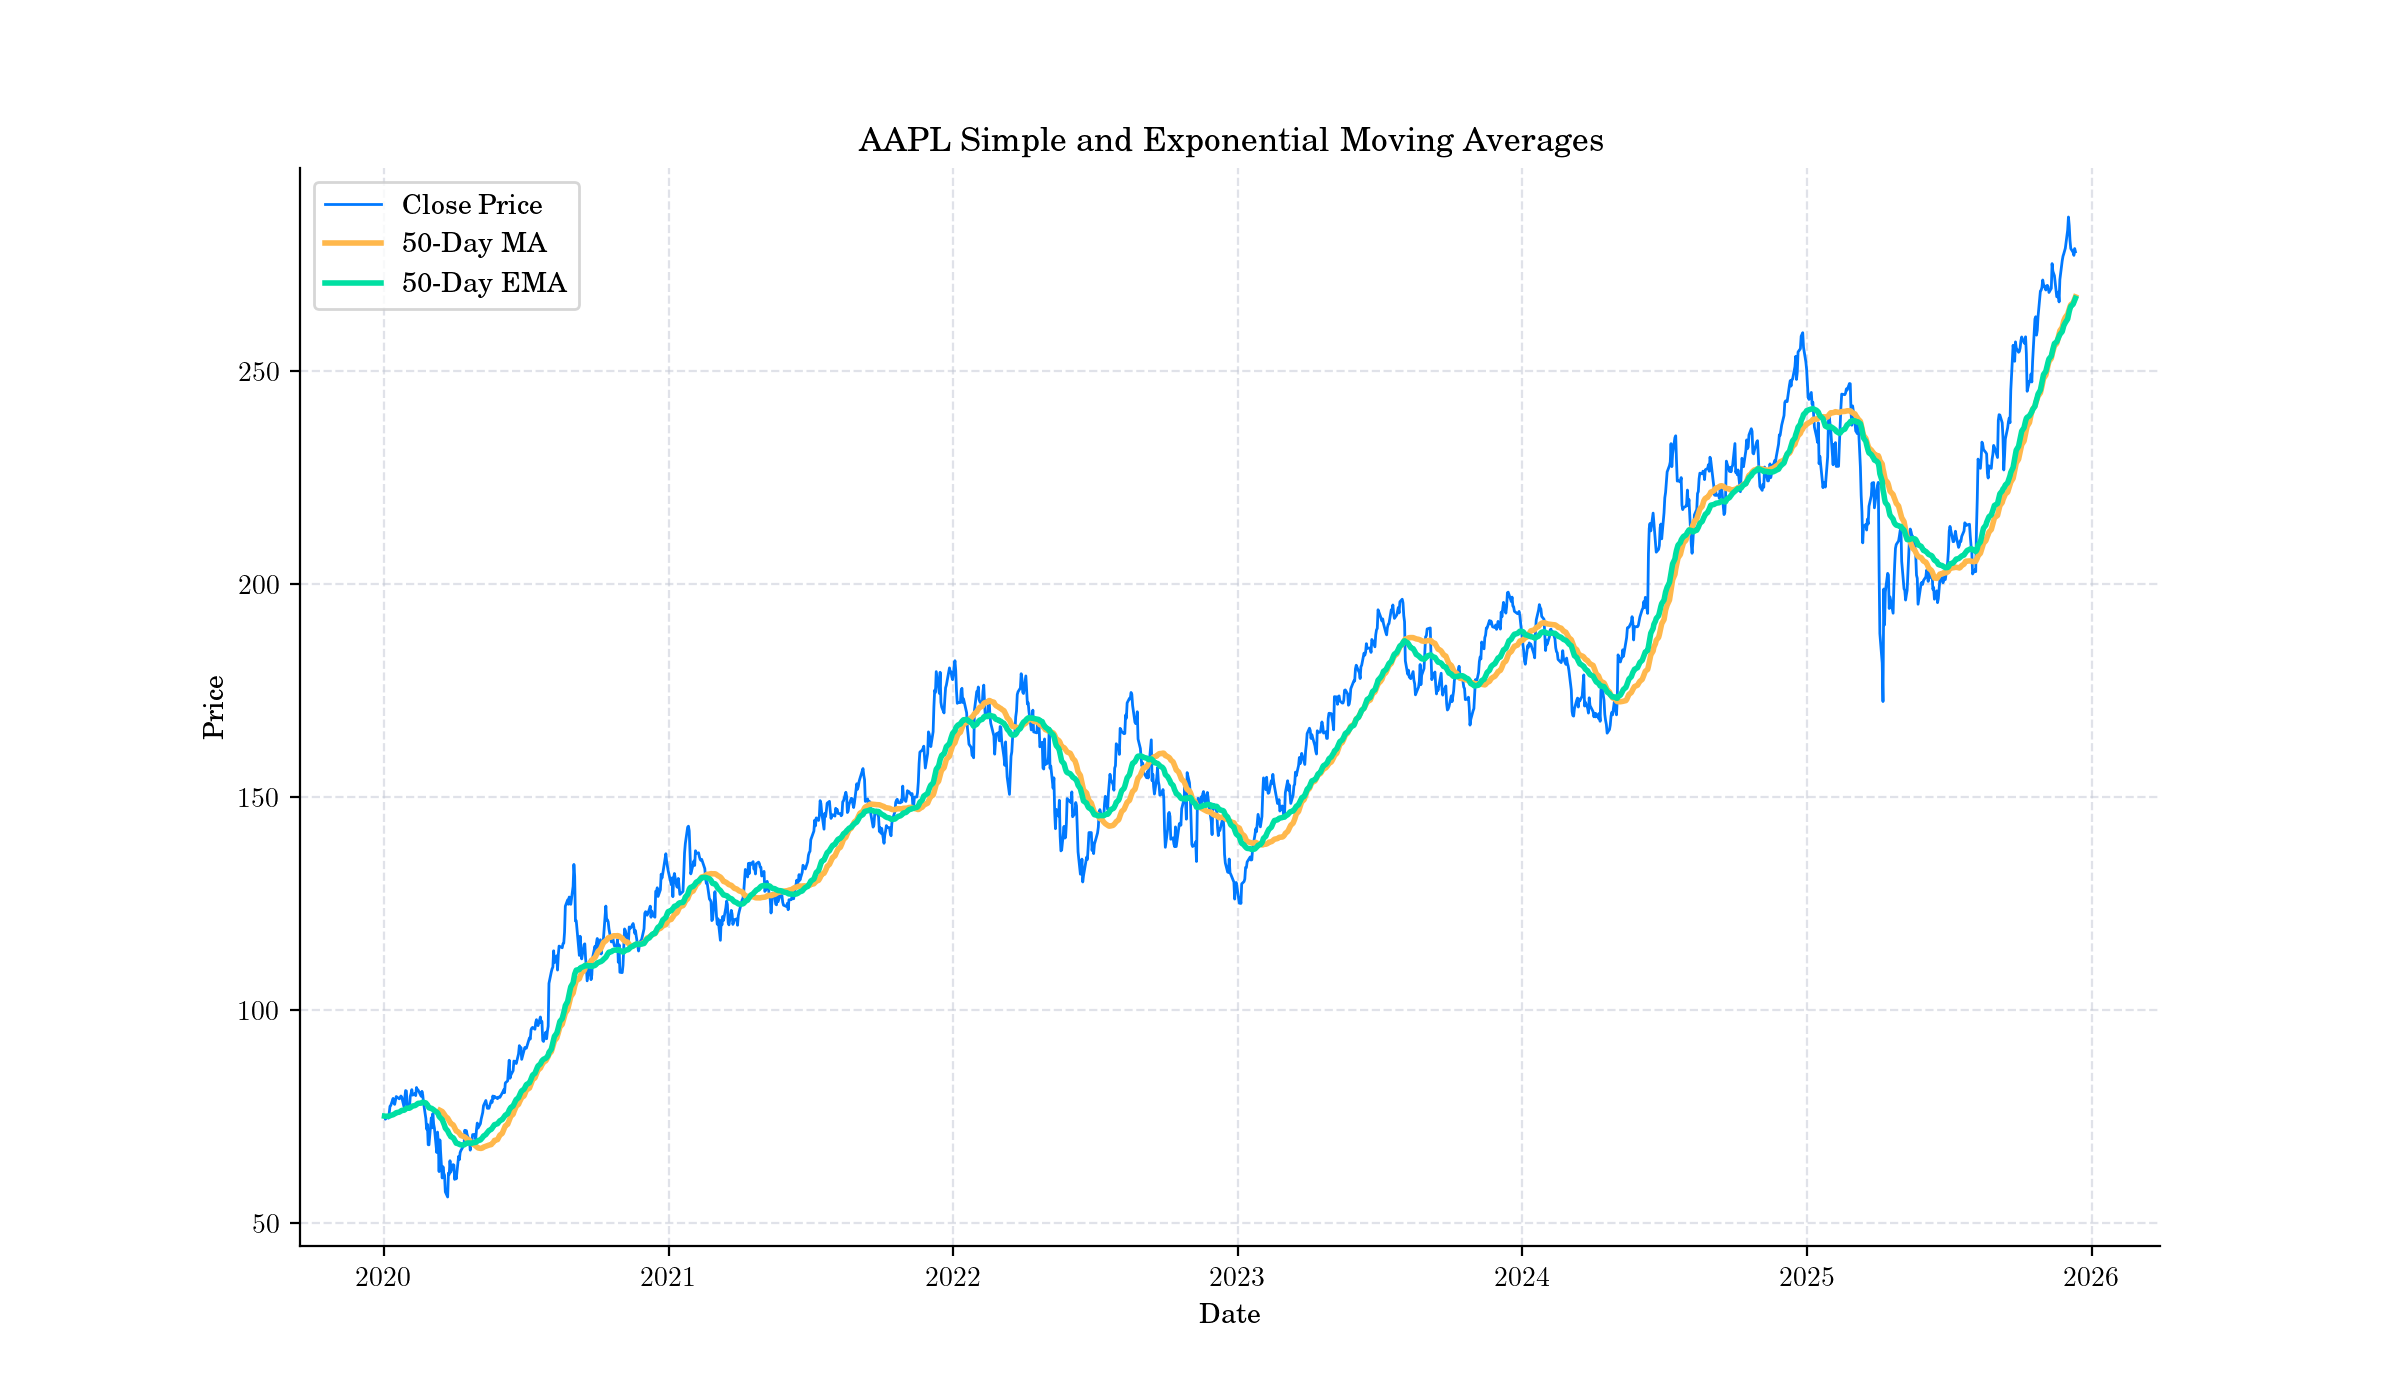
Moving Averages Prices. Source: Yahoo Finance.#
Random Facts#
Development of the moving average concept dates back to 1901, although the name was applied to it later. In 1909 G. U. Yule (Journal of the Royal Statistical Society, 72, 721-730) described the “instantaneous averages” R. H. Hooker calculated in 1901 as “moving-averages.” Yule did not adopt the term in his textbook, but it entered circulation through W. I. King’s Elements of Statistical Method (1912).
The 50-day moving average is often used to gauge intermediate-term trends in stock prices
The 200-day moving average is one of the most watched lines in all of finance. Many institutional mandates forbid long positions when the asset is trading below it.
The Exponential Moving Average is mathematically equivalent to a special case of a Kalman Filter for a constant-mean model.
EWMA volatility used in RiskMetrics™ is exactly the same idea, but applied to squared returns instead of prices.