Note
Go to the end to download the full example code.
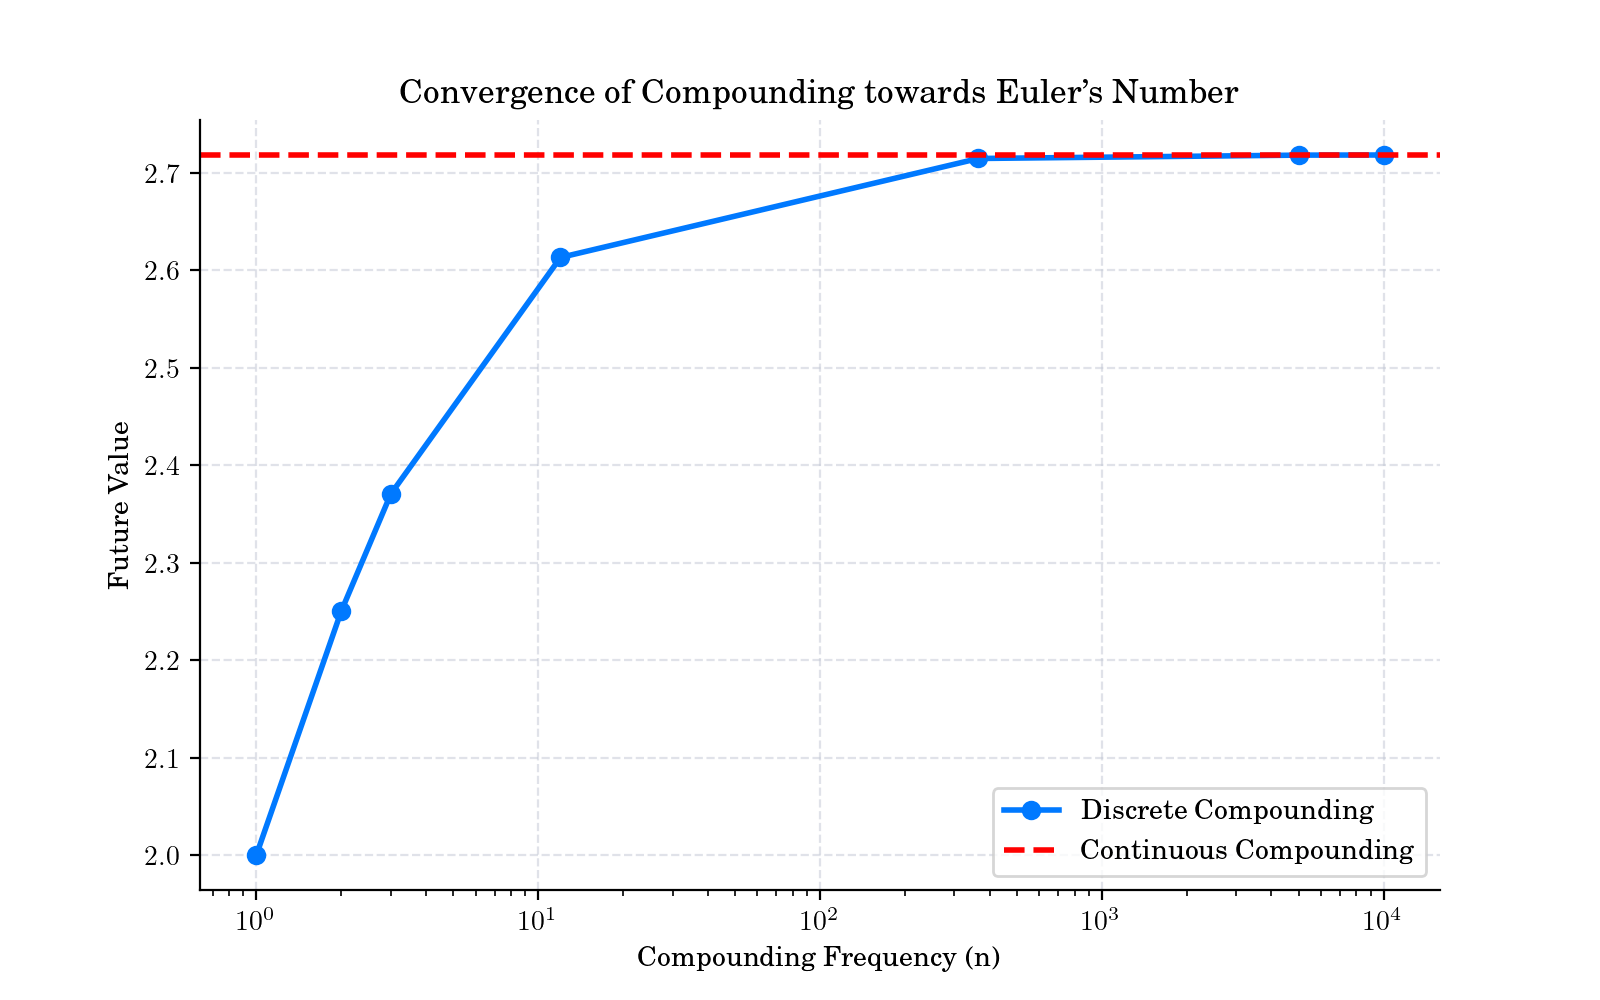
Convergence of Compounding to Euler’s Number#
# Author: Dialid Santiago <d.santiago@outlook.com>
# License: MIT
# Description: Advent Calendar 2025 - Plot E


import numpy as np
import matplotlib.pyplot as plt

plt.style.use(
    "https://raw.githubusercontent.com/quantgirluk/matplotlib-stylesheets/main/quant-pastel-light.mplstyle")

PV = 1
r = 1
T = 1

n_values = [1, 2, 3, 12, 365, 5000, 10000]  # compounding frequencies
FV_list = []

for n in n_values:
    FV = PV * (1 + r/n)**(n*T)
    FV_list.append(FV)

# Continuous compounding
FV_cont = PV * np.exp(r*T)

plt.figure(figsize=(8,5), dpi=200)
plt.plot(n_values, FV_list, marker='o' , label="Discrete Compounding", linewidth=2)
plt.axhline(FV_cont, linestyle='--', label="Continuous Compounding", color='red', linewidth=2)
plt.xscale("log")
plt.xlabel("Compounding Frequency (n)")
plt.ylabel("Future Value")
plt.title("Convergence of Compounding towards Euler's Number")
plt.legend()
plt.show()
Total running time of the script: (0 minutes 2.292 seconds)